Enhancing the VS Code Agent Mode to integrate with Local tools using Model Context Protocol (MCP)

Building a Todo List Server with Model Context Protocol (MCP)

GitHub Repository Node Version MCP SDK

This blog post walks through creating a Todo List server using the Model Context Protocol (MCP), demonstrating how to build AI-friendly tools that integrate seamlessly with VS Code.

πŸ”— Source Code: The complete implementation is available on GitHub

Table of Contents

The Evolution of AI-Assisted Development

I have been using VS Code with GitHub Copilot for development purposes. The introduction of text-based chat, which brought GPT capabilities directly into the IDE, was revolutionary.

GitHub Copilot and the Local Tools Gap

GitHub Copilot has revolutionized how developers write code by providing intelligent code suggestions and completions. While it excels at understanding code context and generating relevant snippets, there has been a notable gap in its ability to interact with local development tools, intranet KBs, and execute actions in the development environment. This limitation means that while Copilot can suggest code, it cannot directly help with tasks like running commands, managing files, or interacting with local services.

Agent Mode: Bridging the Gap

The introduction of Agent Mode in GitHub Copilot represents a significant step forward in AI-assisted development. It enables Copilot to:

  • Execute terminal commands
  • Modify files directly
  • Interact with the VS Code environment
  • Handle project-specific tasks

This advancement transformed Copilot from a passive code suggestion tool into an active development partner that can help manage your entire development workflow. Here are some powerful capabilities and example interactions:

1. Build and Test Automation

Trigger Maven builds with specific profiles:

"Run mvn clean install with the 'production' profile for my project"

Execute JUnit test suites:

"Execute all JUnit tests in the UserServiceTest class"

Run code quality tools:

"Run ESLint on all JavaScript files in the src directory"
"Start a local Sonar analysis with coverage and security scan"

2. Documentation and Release Management

Generate release documentation:

"Generate release notes for changes between tag v1.2.0 and v1.3.0"

Technical documentation:

"Create a technical design document for the authentication service"
"Update the API documentation in Confluence for the new endpoints"

3. Project Management Integration

JIRA ticket management:

"Create a JIRA ticket for the memory leak bug we found in the login service"
"Convert all TODO comments in AuthService.java to JIRA tickets"

Sprint management:

"Update the status of PROJ-123 to 'In Review' and add a comment with the PR link"
"Show me all JIRA tickets assigned to me that are blocking the current sprint"

4. Cross-Repository Operations

Multi-repo analysis:

"Check if the latest changes in the API repo are compatible with our client library"
"Run integration tests across both the frontend and backend repositories"

While these capabilities demonstrate the power of Agent Mode, they highlight a crucial challenge: the need for external API integrations. Each of these tasks requires:

  • Authentication with external services (JIRA, Confluence, Sonar)
  • Managing different API versions and endpoints
  • Handling various authentication methods
  • Maintaining connection states and sessions
  • Coordinating operations across multiple systems

This complexity creates significant overhead for developers who need to:

  1. Implement and maintain integration code for each service
  2. Handle authentication and authorization
  3. Manage API versioning and changes
  4. Deal with different response formats and error handling

MCP: The New Standard for AI Tool Integration

Model Context Protocol (MCP) emerges as the next evolution in this space, providing a standardized way for AI models to interact with development tools and services. Unlike traditional approaches where AI assistants are limited to suggesting code, MCP enables:

  1. Direct Tool Integration

    • AI models can directly invoke local tools
    • Real-time interaction with development environment
    • Standardized communication protocol
  2. Extensible Architecture

    • Custom tool definitions
    • Plugin-based system
    • Easy integration with existing services
  3. Development Environment Awareness

    • Context-aware assistance
    • Access to local resources
    • Real-time feedback loop

What is Model Context Protocol (MCP)?

Model Context Protocol (MCP) is a specification that enables AI models to interact with external tools and services in a standardized way. It defines how tools can expose their functionality through a structured interface that AI models can understand and use.

Key benefits of MCP that I have personally benefited from:

  • Standardized tool definitions with JSON Schema
  • Real-time interaction capabilities
  • Session management
  • Built-in VS Code integration

More about MCP Architecture Documentation

How MCP Tools Work

Each MCP tool follows a standardized structure:

{
  name: "toolName",
  description: "What the tool does",
  parameters: {
    // JSON Schema definition of inputs
  },
  returns: {
    // JSON Schema definition of outputs
  }
}

When an AI model wants to use a tool:

  1. It sends a request with the tool name and parameters
  2. The MCP server validates the request
  3. The tool executes with the provided parameters
  4. Results are returned in a standardized format

This structured approach ensures:

  • Consistent tool behavior
  • Type safety throughout the system
  • Easy tool discovery and documentation
  • Predictable error handling

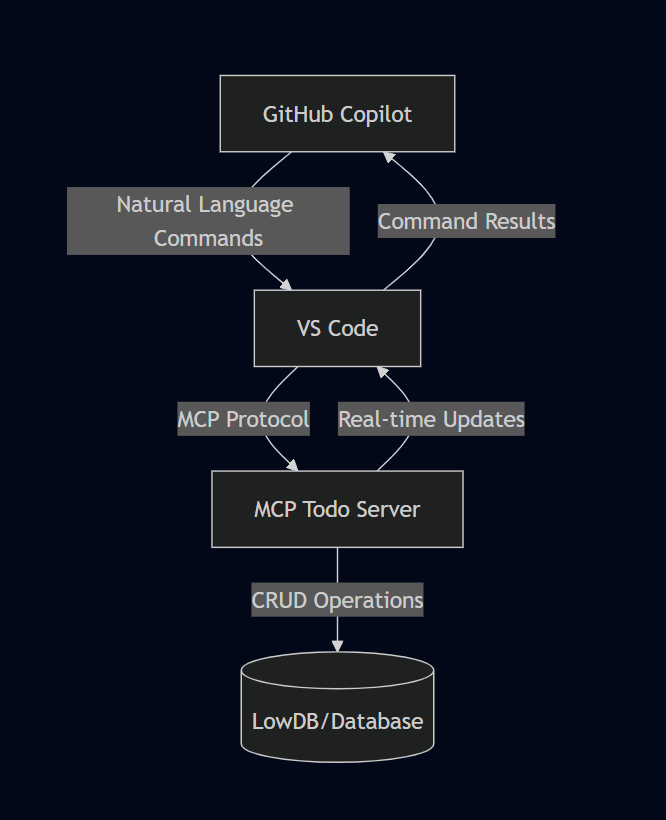
Architecture Overview

Here’s how the different components interact in our MCP Todo implementation:

graph TD
    A[GitHub Copilot] -->|Natural Language Commands| B[VS Code]
    B -->|MCP Protocol| C[MCP Todo Server]
    C -->|CRUD Operations| D[(LowDB/Database)]
    C -->|Real-time Updates| B
    B -->|Command Results| A

TODO MCP Server Components

Prerequisites

To follow along, you’ll need:

  • Node.js (v22 or higher)
  • VS Code
  • Basic understanding of Express.js
  • npm or yarn package manager

Setting Up the Project

  1. First, create a new project and initialize npm:
mkdir mcp-todo-server
cd mcp-todo-server
npm init -y
  1. Install required dependencies:
npm install @modelcontextprotocol/sdk express lowdb zod

For this demonstration, we’re using lowdb to manage tasks in a JSON file without actual integration with an external system. In a production environment, the lowdb functions can be replaced with actual JIRA CRUD API calls for end-to-end implementation.

  1. Create the basic directory structure:
mcp-todo-server/
β”œβ”€β”€ src/
β”‚   β”œβ”€β”€ config/
β”‚   β”œβ”€β”€ tools/
β”‚   β”œβ”€β”€ utils/
β”‚   └── server.js
└── package.json

Implementing the MCP Server

1. Basic Server Setup

We started with a basic Express server that implements the MCP protocol. The server uses StreamableHTTP for real-time communication and session management.

Key components in server.js:

  • Express server setup
  • MCP SDK integration
  • StreamableHTTP transport configuration
  • Session management for maintaining tool state

2. Database Configuration

We used lowdb, a lightweight JSON database, to persist our todos. The database configuration in config/db.js handles:

  • JSON file storage
  • Basic CRUD operations
  • Data persistence between server restarts

3. Implementing Todo Tools

We implemented four main tools for managing todos:

  1. createTodo

    • Creates new todo items
    • Validates input using Zod schema
    • Returns the created todo with a unique ID
  2. listTodos

    • Lists all todos or filters by completion status
    • Formats output for easy reading
    • Supports real-time updates
  3. updateTodo

    • Updates todo completion status
    • Validates input parameters
    • Returns updated todo information
  4. deleteTodo

    • Removes todos by ID
    • Provides completion confirmation
    • Handles error cases gracefully

VS Code Integration

To enable VS Code to use our MCP server, follow these steps:

  1. Enable Agent mode in VS Code. Click on the drop down just before the model listing and select agent from it.

Enable Agent Mode in VS Code

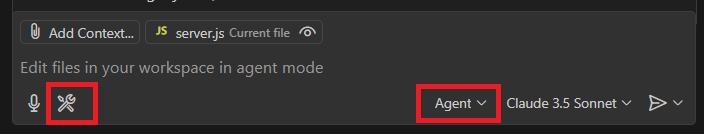
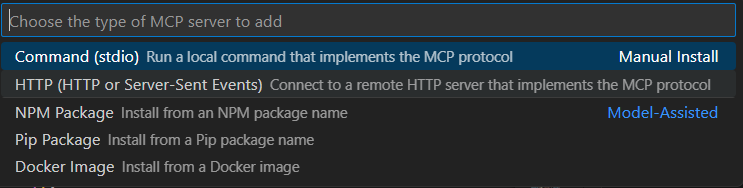
  1. Then click on the Gear icon next to the speaker icon in the above image and select β€œAdd more tools” then select β€œAdd MCP Server”

Add MCP Server

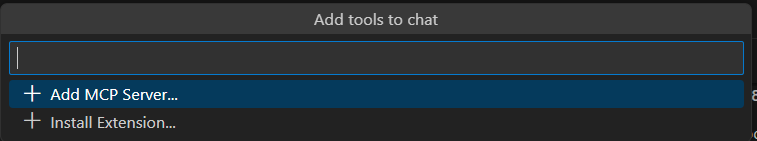
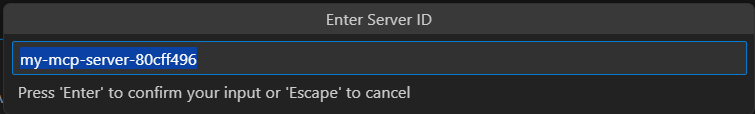
  1. Then select HTTP or Server-Sent Events and provide the URL based on the server we created. In this case, it’s http://localhost:3000. Then select a name for the server.

Select HTTP or Server-Sent events

Provide name

Select settings

  1. Alternatively you can Press
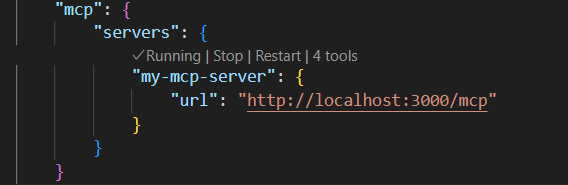
 Ctrl+Shift+P (Windows/Linux) or Cmd+Shift+P (Mac) to open the Command Palette. Type β€œOpen Settings (JSON)” and select it and add the following configuration:
{
    "mcp": {
        "servers": {
            "my-mcp-server": {
                "url": "http://localhost:3000/mcp"
            }
        }
    }
}

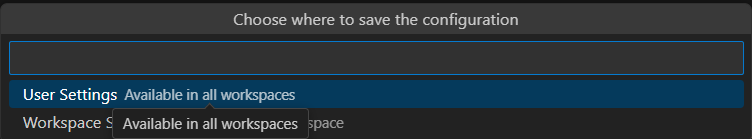
You can use the 4th step to verify if the server is added correctly after the first 3 steps are done. The User Settings option has Start, Stop, and Restart options. This step helped me identify if there are any issues with the MCP tools server effectively.

Settings JSON

  1. Reload VS Code to apply the changes or use the Start, Stop, Restart options in the settings.json as shown above.

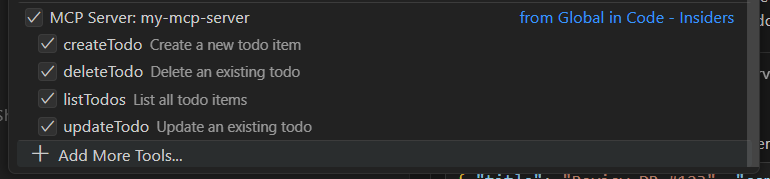
  2. After successful addition of the MCP server, you should see the tools listed when you click the gear icon in the Copilot chat window.

Tools listed successfully

Using the Todo MCP Server

Here are some example prompts you can use in VS Code with GitHub Copilot to interact with the todo server. Each example includes a screenshot of the actual interaction:
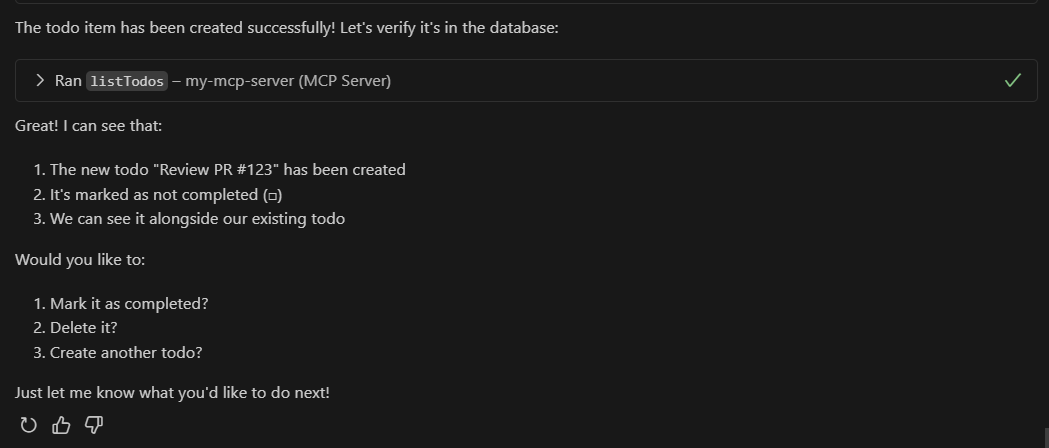
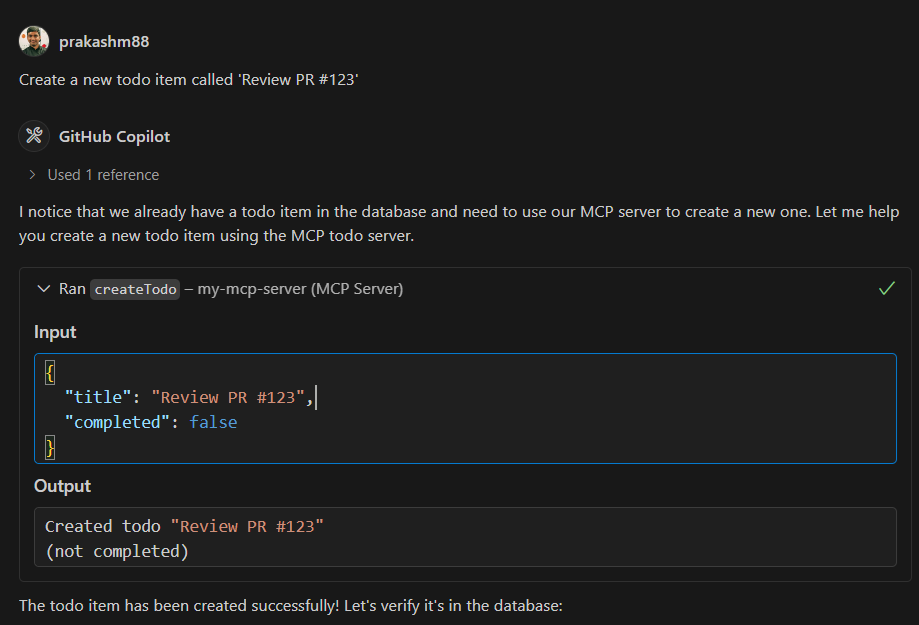
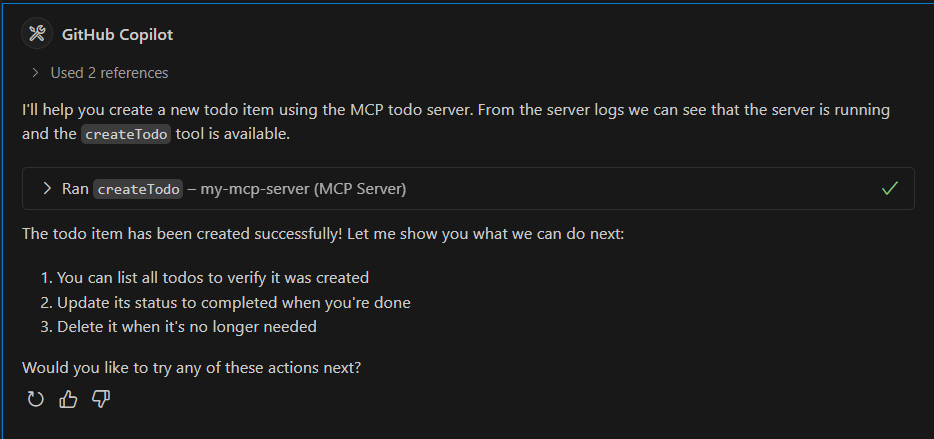
  1. Creating a Todo

    Prompt: "Create a new todo item called 'Review PR #123'"
    Response: Successfully created todo "Review PR #123"
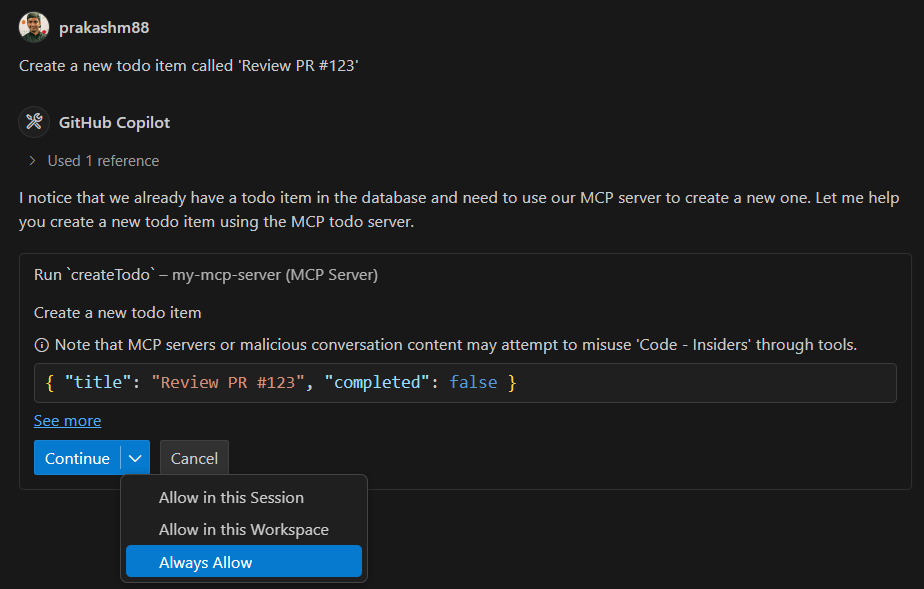
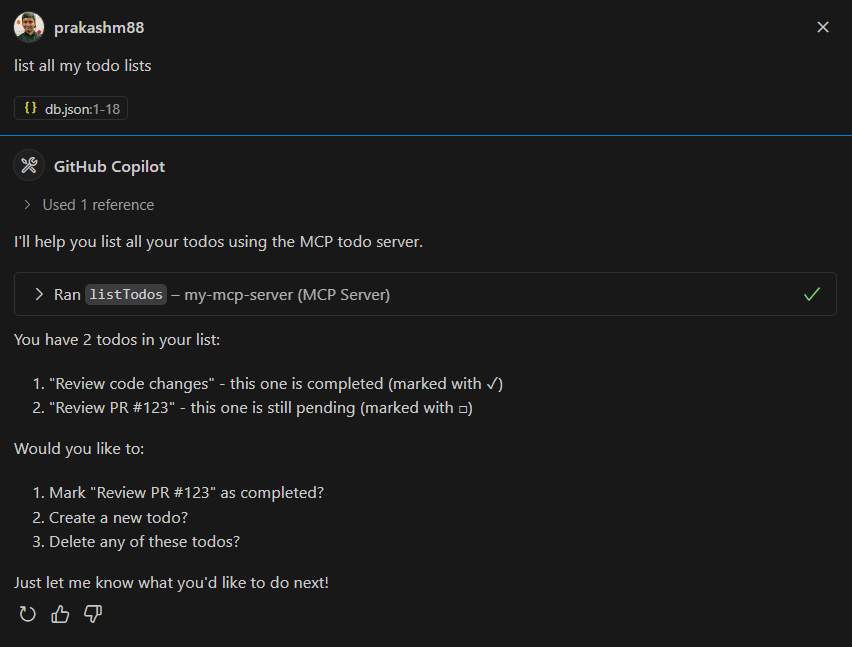
    

    Creating a new todo Execute Add Create TODO success

  2. Listing Todos

    Prompt: "Show me all my todos"
    Response: Here are your todos:
    - Review PR #123 (Not completed)
    - Update documentation (Completed)
    - Setup test environment (Not completed)
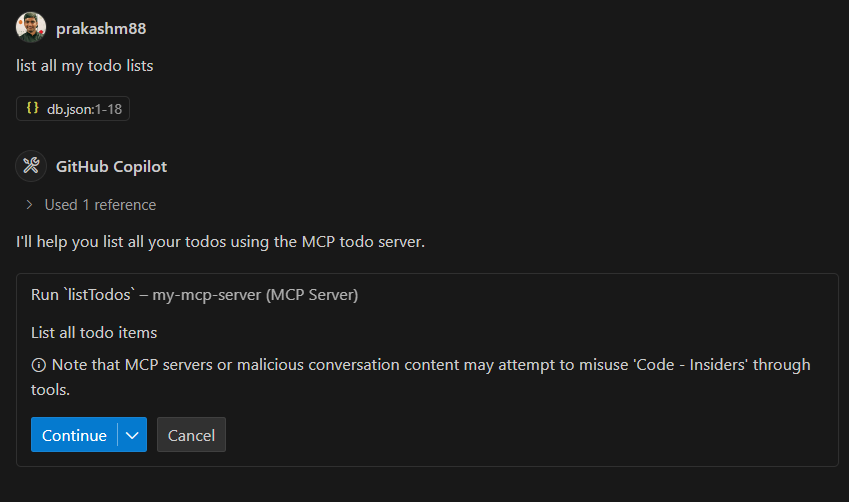
    

    Listing all TODOs execute Listing all TODOs Listing all TODOs

  3. Updating a Todo

    Prompt: "Mark the todo about PR review as completed"
    Response: Updated "Review PR #123" to completed
    
  4. Deleting a Todo

    Prompt: "Delete the todo about documentation"
    Response: Successfully deleted "Update documentation"
    
  5. Filtering Todos

    Prompt: "Show me only completed todos"
    Response: Completed todos:
    - Review PR #123
    

Next Steps and Improvements

Potential enhancements for the project:

  1. Authentication

    • Add user authentication
    • Implement role-based access
  2. Advanced Features

    • Due dates for todos
    • Categories/tags
    • Priority levels
  3. Performance

    • Caching
    • Database optimization
    • Rate limiting
  4. Testing

    • Unit tests
    • Integration tests
    • Load testing

Troubleshooting

Common Issues and Solutions

  1. Server Connection Issues

    • Verify the server is running on port 3000
    • Check VS Code settings for correct server URL
    • Ensure no firewall blocking the connection
  2. Tool Registration Problems

    Error: Tool 'createTodo' not found
    Solution: Check if server is properly initializing tools in server.js
    
  3. Schema Validation Errors

    • Ensure todo items match the required schema
    • Check Zod validation rules in tool implementations
    • Verify JSON payload format
  4. Real-time Updates Not Working

    • Confirm SSE (Server-Sent Events) connection is established
    • Check browser console for connection errors
    • Verify StreamableHTTP transport configuration

Source Code Reference

Key implementation files:

Conclusion

We’ve successfully built a fully functional MCP-compatible Todo server that:

  • Implements CRUD operations
  • Maintains persistent storage
  • Provides real-time updates
  • Integrates seamlessly with VS Code

This implementation serves as a great starting point for building more complex MCP tools and understanding how AI models can interact with custom tools through the Model Context Protocol.

Resources

mcp-todo-server

This project is a simple MCP server that manages a todo list using the Model Context Protocol TypeScript SDK. It provides a RESTful API for creating, updating, and deleting todo items.

Project Structure

mcp-todo-server
β”œβ”€β”€ src
β”‚   β”œβ”€β”€ resources
β”‚   β”‚   └── todos.js
β”‚   β”œβ”€β”€ tools
β”‚   β”‚   β”œβ”€β”€ createTodo.js
β”‚   β”‚   β”œβ”€β”€ updateTodo.js
β”‚   β”‚   └── deleteTodo.js
β”‚   β”œβ”€β”€ config
β”‚   β”‚   └── db.js
β”‚   β”œβ”€β”€ utils
β”‚   β”‚   └── sessionManager.js
β”‚   └── server.js
β”œβ”€β”€ db.json
β”œβ”€β”€ package.json
β”œβ”€β”€ .gitignore
└── README.md

Installation

  1. Clone the repository:

    git clone https://github.com/prakashm88/mcp-todo-server.git
    cd mcp-todo-server
    
  2. Install the dependencies:

    npm install
    

Usage

To start the server, run:

npm start

The server will listen on port 3000.

API Endpoints

  • POST /mcp: Handles client-to-server communication for creating and managing todos.
  • GET /mcp: Retrieves server-to-client notifications.
  • DELETE /mcp: Terminates a session.

Database

The project uses lowdb to manage the todo items, stored in db.json.

Contributing

Contributions are welcome! Here’s how you can help:

  1. Fork the repository
  2. Create a feature branch: git checkout -b feature/my-new-feature
  3. Commit your changes: git commit -am 'Add new feature'
  4. Push to the branch: git push origin feature/my-new-feature
  5. Submit a pull request

You can also:

  • Report bugs by creating issues
  • Suggest improvements through discussions
  • Help improve documentation

Please read our Contributing Guidelines for more details.

Browser extension sample – Chrome/Edge – HttpRequestViewer

Browser Extensions

The Evolution of Browser Extensions: From Web Customization to Advanced Development Tools – Part 2
We discussed about The evolution of the Browser extensions in the previous post. Lets quick learn how to create a Chrome/Edge/Firefox extension. I have mentioned “Advanced development tools” in the title, but never got chance to explore those capabilities earlier. We will create a simple extension to explore the power of it.

Creating a browser extension has never been easier, thanks to the comprehensive documentation and support provided by browser vendors. Below, we’ll walk through the steps to create a simple extension for both Chrome and Microsoft Edge using Manifest V3. We will use this tool to print the list of HTTP requests that are fired in a given browser and list it in the page.

Basics of extensions:

Manifests – A manifest is a JSON file that contains metadata about a browser extension, such as its name, version, permissions, and the files it uses. It serves as the blueprint for the extension, informing the browser about the extension’s capabilities and how it should be loaded.

Key Components of a Manifest File:

Here are the key components typically found in a Manifest V3 file:

1. Manifest Version: There are different versions of the manifest file, with Manifest V3 being the latest and most widely adopted version. Manifest V3 introduces several changes aimed at improving security, privacy, and performance with lot of controversies around it. Read more about the controversies at Ghostery.
2. Name and Version: These fields define the name and version of the extension. Choose a unique name and version. An excellent guide of version semantics is available here.
3. Description: A short description of the extension’s functionality.
4. Action: Defines the default popup and icon for the browser action (e.g., toolbar button).
5. Background: Specifies the background script that runs in the background and can handle events like network requests and alarms.
6. Content Scripts: Defines scripts and stylesheets to be injected into matching web pages.
7. Permissions: Lists the permissions the extension needs to operate, such as access to tabs, storage, and specific websites.
8. Icons: Specifies the icons for the extension in different sizes. For this post I created a simple icon using Microsoft Designer. I gave a simple prompt with the description above and I got the below image. Extension requires different sizes for showing it in different places. I used Chrome Extension Icon Generator and generated different sizes as needed.

Β  Β  Β 

9. Web Accessible Resources: Defines which resources can be accessed by web pages.

Create a project structure as follows:

HttpRequestViewer/
|-- manifest.json
|-- popup.html
|-- popup.js
|-- background.js
|-- history.html
|-- history.js
|-- popup.css
|-- styles.css
|-- icons/
    |-- icon.png
    |-- icon16.png
    |-- icon32.png
    |-- icon48.png
    |-- icon128.png

Manifest.json

{
  "name": "API Request Recorder",
  "description": "Extension to record all the HTTP request from a webpage.",
  "version": "0.0.1",
  "manifest_version": 3,
  "host_permissions": [""],
  "permissions": ["activeTab", "webRequest", "storage"],
  "action": {
    "default_popup": "popup.html",
    "default_icon": "icons/icon.png"
  },
  "background": {
    "service_worker": "background.js"
  },
  "icons": {
    "16": "icons/icon16.png",
    "32": "icons/icon32.png",
    "48": "icons/icon48.png",
    "128": "icons/icon128.png"
  },
  "content_security_policy": {
    "extension_pages": "script-src 'self'; object-src 'self';"
  },
  "web_accessible_resources": [{ "resources": ["images/*.png"], "matches": ["https://*/*"] }]
}

popup.html
We have two options with the extension.

1. A button with record option to start recording all the HTTP requests
2. Link to view the history of HTTP Requests recorded

<!DOCTYPE html>
<html>
  <head>
    <title>API Request Recorder</title>

    <link rel="stylesheet" href="popup.css" />
  </head>
  <body>
    <div class="heading">
      <img class="logo" src="icons/icon48.png" />
      <h1>API Request Recorder</h1>
    </div>
    <button id="startStopRecord">Record</button>

    <div class="button-group">
      <a href="#" id="history">View Requests</a>
    </div>

    <script src="popup.js"></script>
  </body>
</html>

popup.js
Two event listeners are registered for recording (with start / stop) and viewing history.
First event is used to send a message to the background.js, while the second one instructs chrome to open the history page in new tab.

document.getElementById("startStopRecord").addEventListener("click", () => {
  chrome.runtime.sendMessage({ action: "startStopRecord" });
});

document.getElementById("history").addEventListener("click", () => {
  chrome.tabs.create({ url: chrome.runtime.getURL("/history.html") });
});

history.html

 
<!DOCTYPE html>
<html>
  <head>
    <title>History</title>
    <link rel="stylesheet" href="styles.css" />
  </head>
  <body>
    <h1>History Page</h1>
    <table>
      <thead>
        <tr>
		  <th>Method</th>
          <th>URL</th>
          <th>Body</th>
        </tr>
      </thead>
      <tbody id="recorded-data-body">
        <!-- Data will be populated here -->
      </tbody>
    </table>
    <script src="history.js"></script>
  </body>
</html>

history.js
Requests background.js to “getRecordedData” and renders the result in the html format.

document.addEventListener("DOMContentLoaded", () => {
  chrome.runtime.sendMessage({ action: "getRecordedData" }, (response) => {
    const tableBody = document.getElementById("recorded-data-body");
    response.forEach((record) => {
      const row = document.createElement("tr");
      const urlCell = document.createElement("td");
      const methodCell = document.createElement("td");
      const bodyCell = document.createElement("td");

      urlCell.textContent = record.url;
      methodCell.textContent = record.method;
      bodyCell.textContent = record.body;

      row.appendChild(methodCell);
      row.appendChild(urlCell);
      row.appendChild(bodyCell);
      tableBody.appendChild(row);
    });
  });
});

background.js
Background JS works as a service worker for this extension, listening and handling events.
The background script does not have access to directly manipulate the user page content, but can post results back for the popup/history script to handle the cosmetic changes.

let isRecording = false;
let recordedDataList = [];

chrome.runtime.onMessage.addListener((message, sender, sendResponse) => {
  console.log("Obtined message: ", message);
  if (message.action === "startStopRecord") {
    if (isRecording) {
      isRecording = false;
      console.log("Recording stopped...");
      sendResponse({ recorder: { status: "stopped" } });
    } else {
      isRecording = true;
      console.log("Recording started...");
      sendResponse({ recorder: { status: "started" } });
    }
  } else if (message.action === "getRecordedData") {
    sendResponse(recordedDataList);
  } else {
    console.log("Unhandled action ...");
  }
});

chrome.webRequest.onBeforeRequest.addListener(
  (details) => {
    if (isRecording) {
      let requestBody = "";
      if (details.requestBody) {
        if (details.requestBody.formData) {
          requestBody = JSON.stringify(details.requestBody.formData);
        } else if (details.requestBody.raw) {
          requestBody = new TextDecoder().decode(new Uint8Array(details.requestBody.raw[0].bytes));
        }
      }
      recordedDataList.push({
        url: details.url,
        method: details.method,
        body: requestBody,
      });
      console.log("Recorded Request:", {
        url: details.url,
        method: details.method,
        body: requestBody,
      });
    }
  },
  { urls: [""] },
  ["requestBody"]
);

Lets load the Extension

All set, now lets load the extension and test it.

  • Open Chrome/Edge and go to chrome://extensions/ or edge://extensions/ based on your browser.
  • Enable “Developer mode” using the toggle in the top right corner.
  • Click “Load unpacked” and select the directory of your extension.

Load extensionupload extension

  • Your extension should now be loaded, and you can interact with it using the popup.
  • When you click the “Record” button, it will start logging API requests to the console.

  • Click the “Record” button again and hit the “View requests” link in the popup to view the history of APIs.

I have a sample page (https://itechgenie.com/demos/apitesting/index.html) with 4 API calls, which also loads images based on the API responses. You could see all the API requests that is fired from the page including the JS, CSS, Images and API calls.


Now its up to the developers imagination to build the extension to handle these APIs request and response data and give different experience.

Code is available in GitHub at HttpRequestViewer

Enable Registration in WordPress

In WordPress custom installations, the option for Registration of new users is disabled by default. To enable the registrations and allow logins for public you can follow the below steps.

Single site installation:

As soon as the installation is completed go to the WordPress Dashboard -> Settings

You will find an option Allow new registrations, you may need to select the Default Role for the newly registered members.

wp-user-registeration-single-site

Multi-site/Network installation:

In case if you have installed WordPress in Multi site mode go to the Network Admin -> Settings and select the options under Allow new registrations section.

wp-user-registeration-multi-site

Once the registration is enabled it may be needed to add login options at places to find it easily. Follow these methods to do the same.

Method 1:

Add Meta widget in the sidebars or in footers. Select Appearance -> Widgets and select the Meta Widget.Β  Note that the menu will be available in Individual Site Dashboard, not in the Network Admin dashboard in case of Multi-site installation.

wp-user-login-widget


Method 2:

Add the login link in your Posts/Pages and it should be in the pattern, http(s)://HOSTNAME(:PORT)/(SUBDOMAINS)/wp-login.php.

Examples:

  1. http://itechgenie.com/myblog/wp-login.php – MultiSite installation
  2. http://itechgenie.com/wp-login.php – SingleSite installation

Maven and Cloud Foundry Integration

Cloud Fountry provides as easy integration plugins to move the build packages to its servers through Maven. Here is the sample configuration.

Add Servers to settings.xml

<settings> 
	...
	<servers>
		... 
		<server>
			<id>cloud-foundry-credentials</id>
			<username>cf_user_id_you_created</username>
			<password>cf_password_you_created</password>
		</server>
	</servers> 
</settings>

You can encrypt you password in MAVEN settings. Check out here on how to do it.

Add Dependency and Plugin settings in pom.xml

</project>
	...	
	<build>
		...
		<plugins>
				<groupId>org.cloudfoundry</groupId>
				<artifactId>cf-maven-plugin</artifactId>
				<version>1.1.3</version>
				<configuration>
					<server>cloud-foundry-credentials</server>
					<target>https://url.to.cloud.foundry.com</target>
					<memory>512</memory>
					<appname>application-name</appname>
					<org>ORG_NAME</org>
					<space>SPACE_NAME</space>
					<instances>1</instances>
				</configuration>
				<executions>
					<execution>
						<phase>package</phase>
						<goals>
							<goal>push</goal>
						</goals>
					</execution>
				</executions>
		</plugins>
	</build>
</project>

Thats it !!. Build you project using Maven and check if you application gets deployed into your Cloud Foundry server.

Installing Oracle JDK in Amazon AWS EC2 Ubuntu

Lately I tried to install Oracle JDK in one of my Ubuntu servers on Amazon EC2 instance. Unfortunately the inbuilt installers support the installation of OpenJDK.

For some requirements, I was in need of installing a specific version of JDK and test my application, you could get the older version from Oracle Site. I used the following script from one of the blogs, hope it helps someone.

#!/usr/bin/env bash
wget -O 'jdk-7u80-linux-x64.tar.gz' --no-cookies --no-check-certificate --header 'Cookie:gpw_e24=http://www.oracle.com; oraclelicense=accept-securebackup-cookie' 'http://download.oracle.com/otn-pub/java/jdk/7u80-b15/jdk-7u80-linux-x64.tar.gz'
tar -xvf jdk-7u80-linux-x64.tar.gz
sudo mkdir /usr/lib/jvm
sudo mv ./jdk1.7* /usr/lib/jvm/jdk1.7.0
sudo update-alternatives --install "/usr/bin/java" "java" "/usr/lib/jvm/jdk1.7.0/bin/java" 1
sudo update-alternatives --install "/usr/bin/javac" "javac" "/usr/lib/jvm/jdk1.7.0/bin/javac" 1
sudo update-alternatives --install "/usr/bin/javaws" "javaws" "/usr/lib/jvm/jdk1.7.0/bin/javaws" 1
sudo chmod a+x /usr/bin/java
sudo chmod a+x /usr/bin/javac
sudo chmod a+x /usr/bin/javaws

The Key here is Oracle need you to accept the license terms before using the any version of Oracle JDK. You could do the same from the scripting by just adding --no-cookies --no-check-certificate --header 'Cookie:gpw_e24=http://www.oracle.com; oraclelicense=accept-securebackup-cookie' params to the WGET.

Alternative, you could download the installers/zip files from external CDNs, like REUCON, move it to EC2 instance through SFTP and install it.

Adding Oracle Datasource to JBoss EAP server

To add a Oracle Datasource to the JBOSS server, follow the steps

1. In the standalone.xml or in standalone-full.xml

<subsystem xmlns="urn:jboss:domain:datasources:1.2">
		<datasources>
			<datasource jndi-name="java:jboss/datasources/ExampleDS" pool-name="ExampleDS" enabled="true" use-java-context="true">
				<connection-url>jdbc:h2:tcp://localhost/~/jbpm-db-new;MVCC=TRUE;DB_CLOSE_DELAY=-1;DB_CLOSE_ON_EXIT=FALSE</connection-url>
				<driver>h2</driver>
				<security>
					<user-name>sa</user-name>
					<password>sa</password>
				</security>
			</datasource>
			<datasource jndi-name="java:jboss/datasources/JbpmDS" pool-name="JbpmDS" enabled="true" use-java-context="true">
				<connection-url>jdbc:oracle:thin:@localhost:1521:XE</connection-url>
				<driver>oracle</driver>
				<security>
					<user-name>username</user-name>
					<password>password</password>
				</security>
			</datasource>
			<drivers>
				<driver name="h2" module="com.h2database.h2">
					<xa-datasource-class>org.h2.jdbcx.JdbcDataSource</xa-datasource-class>
				</driver>
				<driver name="oracle" module="com.oracle.jdbc">
					<driver-class>oracle.jdbc.driver.OracleDriver</driver-class>
					<xa-datasource-class>oracle.jdbc.xa.client.OracleXADataSource</xa-datasource-class>
				</driver>
			</drivers>
		</datasources>
</subsystem>

2. In $JBOSS_HOME/modules/com/oracle/jdbc/main I have copied the ojdbc6.jar and created the module.xml file.

<?xml version="1.0" encoding="UTF-8"?>
<module xmlns="urn:jboss:module:1.0" name="com.oracle.jdbc">
  <resources>
    <resource-root path="ojdbc6.jar"/>
  </resources>
  <dependencies>
    <module name="javax.api"/>
    <module name="javax.transaction.api"/>
  </dependencies>
</module>

3. Now you could use the JNDI “java:jboss/datasources/JbpmDS” in your application

Android device showing offline with USB debugging

When I tried to run Android application in my mobile from Android Studio, I stuck with the error stating the application my Device was Offline.

When I run the command adb devices the error as follows

List of devices attached
00b445g34****** offline

To Enable the USB debugging option in Android device

1. Go to Settings, and select Applications > Development
2. Enable USB debugging
3. For Devices with Android KitKat and go to Settings > About devices > Tap 7 times on “Build Number”
4. Once Developer Option is enabled in the Settings, Enable USB debugging
5. Update the Android SDK Tools in Android SDK Manager
6. Traverse to \android-sdk\platform-tools and run adb devices
7. If still the problem exists restart the ADB server

adb kill-server
set ADB_TRACE=all
adb nodaemon server
adb devices

8. The ADB_TRACE will help you trace and resolving the issues like permission and others.
9. If still the problem exists kill the adb process killall adb in linuxoids and taskkill /IM adb.exe
10. Disconnect your mobile, Developer option > Revoke USB debugging authorizations (KitKat and above)
11. Restart your mobile and connect to PC. You will be asked to verify the RSA, do the same and add the device
12. Now try running adb devices, boom the device is online

List of devices attached
00b445g34****** device

The same scenario happened when I tried to run debug my AIR application in Flash developer, follow all the steps above in addition the next few steps too.

1. Copy the following files from \android-sdk\platform-tools aapt.exe, adb.exe, AdbWinApi.dll, AdbWinUsbApi.dll, dx.jar (dx.jar from lib folder)
2. Paste them into \lib\android\bin
3. Run the command adb version from the same folder in command prompt
4. Result should be as follows
Android Debug Bridge version 1.0.31
5. Version should be greater or equal to 1.0.31

Errors running builder ‘JavaScript Validator’ on project

I got this annoying exception on every auto build of my Dynamic Web Project.

“Errors occurred during the build.
Errors running builder ‘JavaScript Validator’ on project ‘GenieAlert’.
java.lang.NullPointerException”

I was trying to stop the validation of Javascript in the Eclipse properties with the following options,

Windows -> Preferences -> Validation -> Client-side JavaScript Validator -> Checked Manual & Unchecked Build.

This option didn’t work out, then I realized that it happens only on the Build time. The following option came in handy to do that.

Project -> Properties -> Builders -> Unchecked ‘Javascript Validator’

Sometimes when you try to run the Web projects from eclipse on servers these JavaScript validation stops the deployment of the project on servers stating “JavaScript Validation Exception found”. I hope the above solutions will help in those situations too.

Bhuvan, The Earth browser – A Geoportal of Indian Space Research Organisation

Most of us would have used the mapping services like Google Maps, Nokia Maps, Bing maps, Wiki Mapia etc on the net. But how many of us knew that we in India have a dedicated Mapping system. Yes, all those PSLV family satellites, Remote sensing satellites from ISRO send us a lot of images; details etc daily and these details are available to the public’s view.

Bhuvan is a Geo-portal of Indian Space Research Organization Showcasing Indian Imaging Capabilities in Multi-sensor, Multi-platform and Multi-temporal domain. This Earth browser gives a gateway to explore and discover virtual earth in 3D space with specific emphasis on Indian Region. The other services provided by the Bhuvan are Land services, Ground water prospects, Weather services, Ocean services, Disaster services

The Mapping system provides both the 2D and 3D viewing capability and can see information that is otherwise dry and academic, in ways that are visually fascinating. It helps you capture large databases of satellite data, which can be transformed into 3D presentations that capture the imaginations of the rest of us. Users can experience the comprehensive globe with multi resolution imagery, thematic information, historical multi temporal imagery, and other points of interest. As a User we can explore and visualize the world in a 3D landscape along with all other wide ranging tools to explore Bhutan.

Bhuvan also provides a mobile version of its site and can be accessed from here.

As a feast for developers, Bhuvan also provides the API’s to embed a true 3D digital globe, into the web pages. Using the API you can draw markers and lines, drape images over the terrain, allowing you to build sophisticated 3D map applications.

Bhuvan Quick Tour:

If you are unable view the video, click Here to download.