![]()
🎭 ITG Playwright Studio
The ultimate web-based control plane for Playwright tests.
Playwright Studio is a centralized testing platform designed to simplify the recording, management, and execution of automated user journeys. It provides a visual interface for managing test suites, triggering parallel runs, and analyzing rich execution reports—all from a single, beautiful dashboard.
✨ Key Features
- 🚀 Multi-File Test Execution: Select multiple test files and run them in a single batch with full parallelization.
- 📁 Integrated File Manager: Browse, edit, and manage your Playwright test repository directly in the browser using a Monaco-based editor.
- 📊 Detailed Execution History: Track every run with status, duration, and full command-line logs.
- 📑 Rich Reporting: Built-in support for Monocart and HTML reporters with direct viewing from the history tab.
- 🔄 Local Sync: Automatically discovers and synchronizes your existing Playwright project folders into the database.
- 🛡️ Secure Access: Token-based authentication and Role-Based Access Control (RBAC) foundation.
- 📅 Advanced Scheduling: Schedule tests to run automatically with cron-like precision.
- 🤖 CLI Agent: Run tests locally with Studio-managed configurations using the
itgps-agentcommand-line tool.
📸 Visual Tour
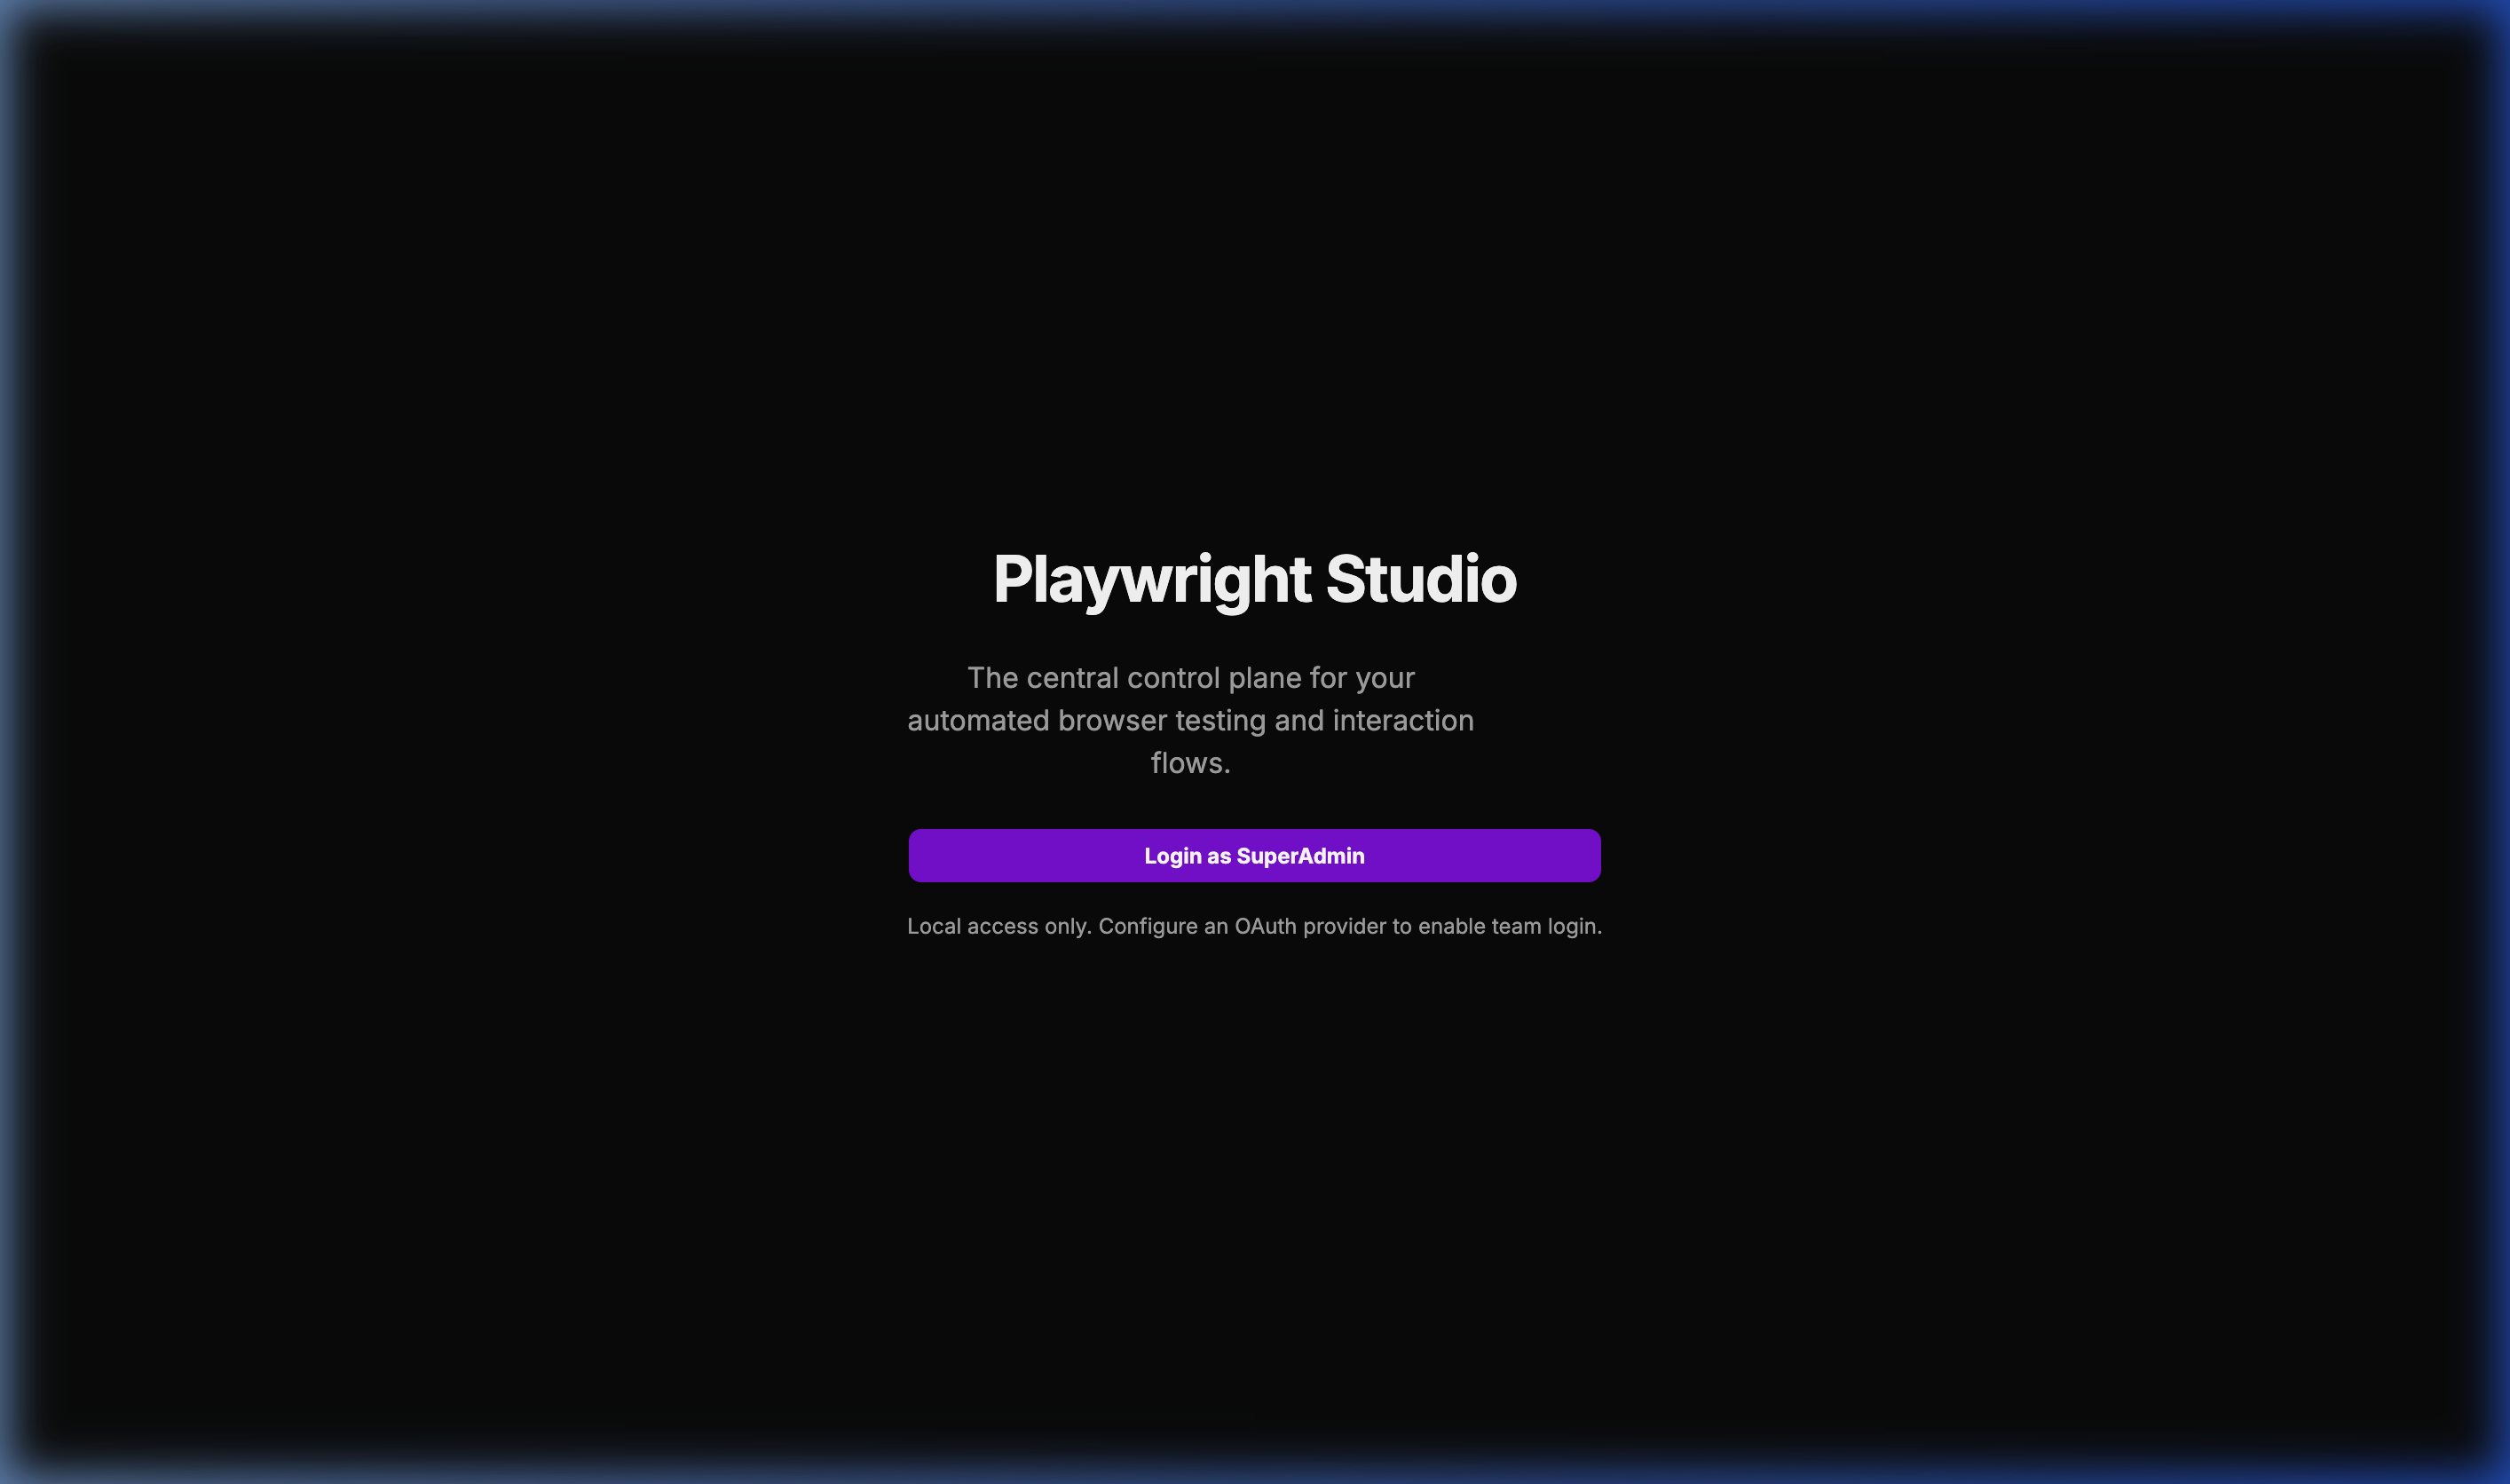
🔐 Multi-Provider Login
The entry point supporting OAuth and local administrative access.
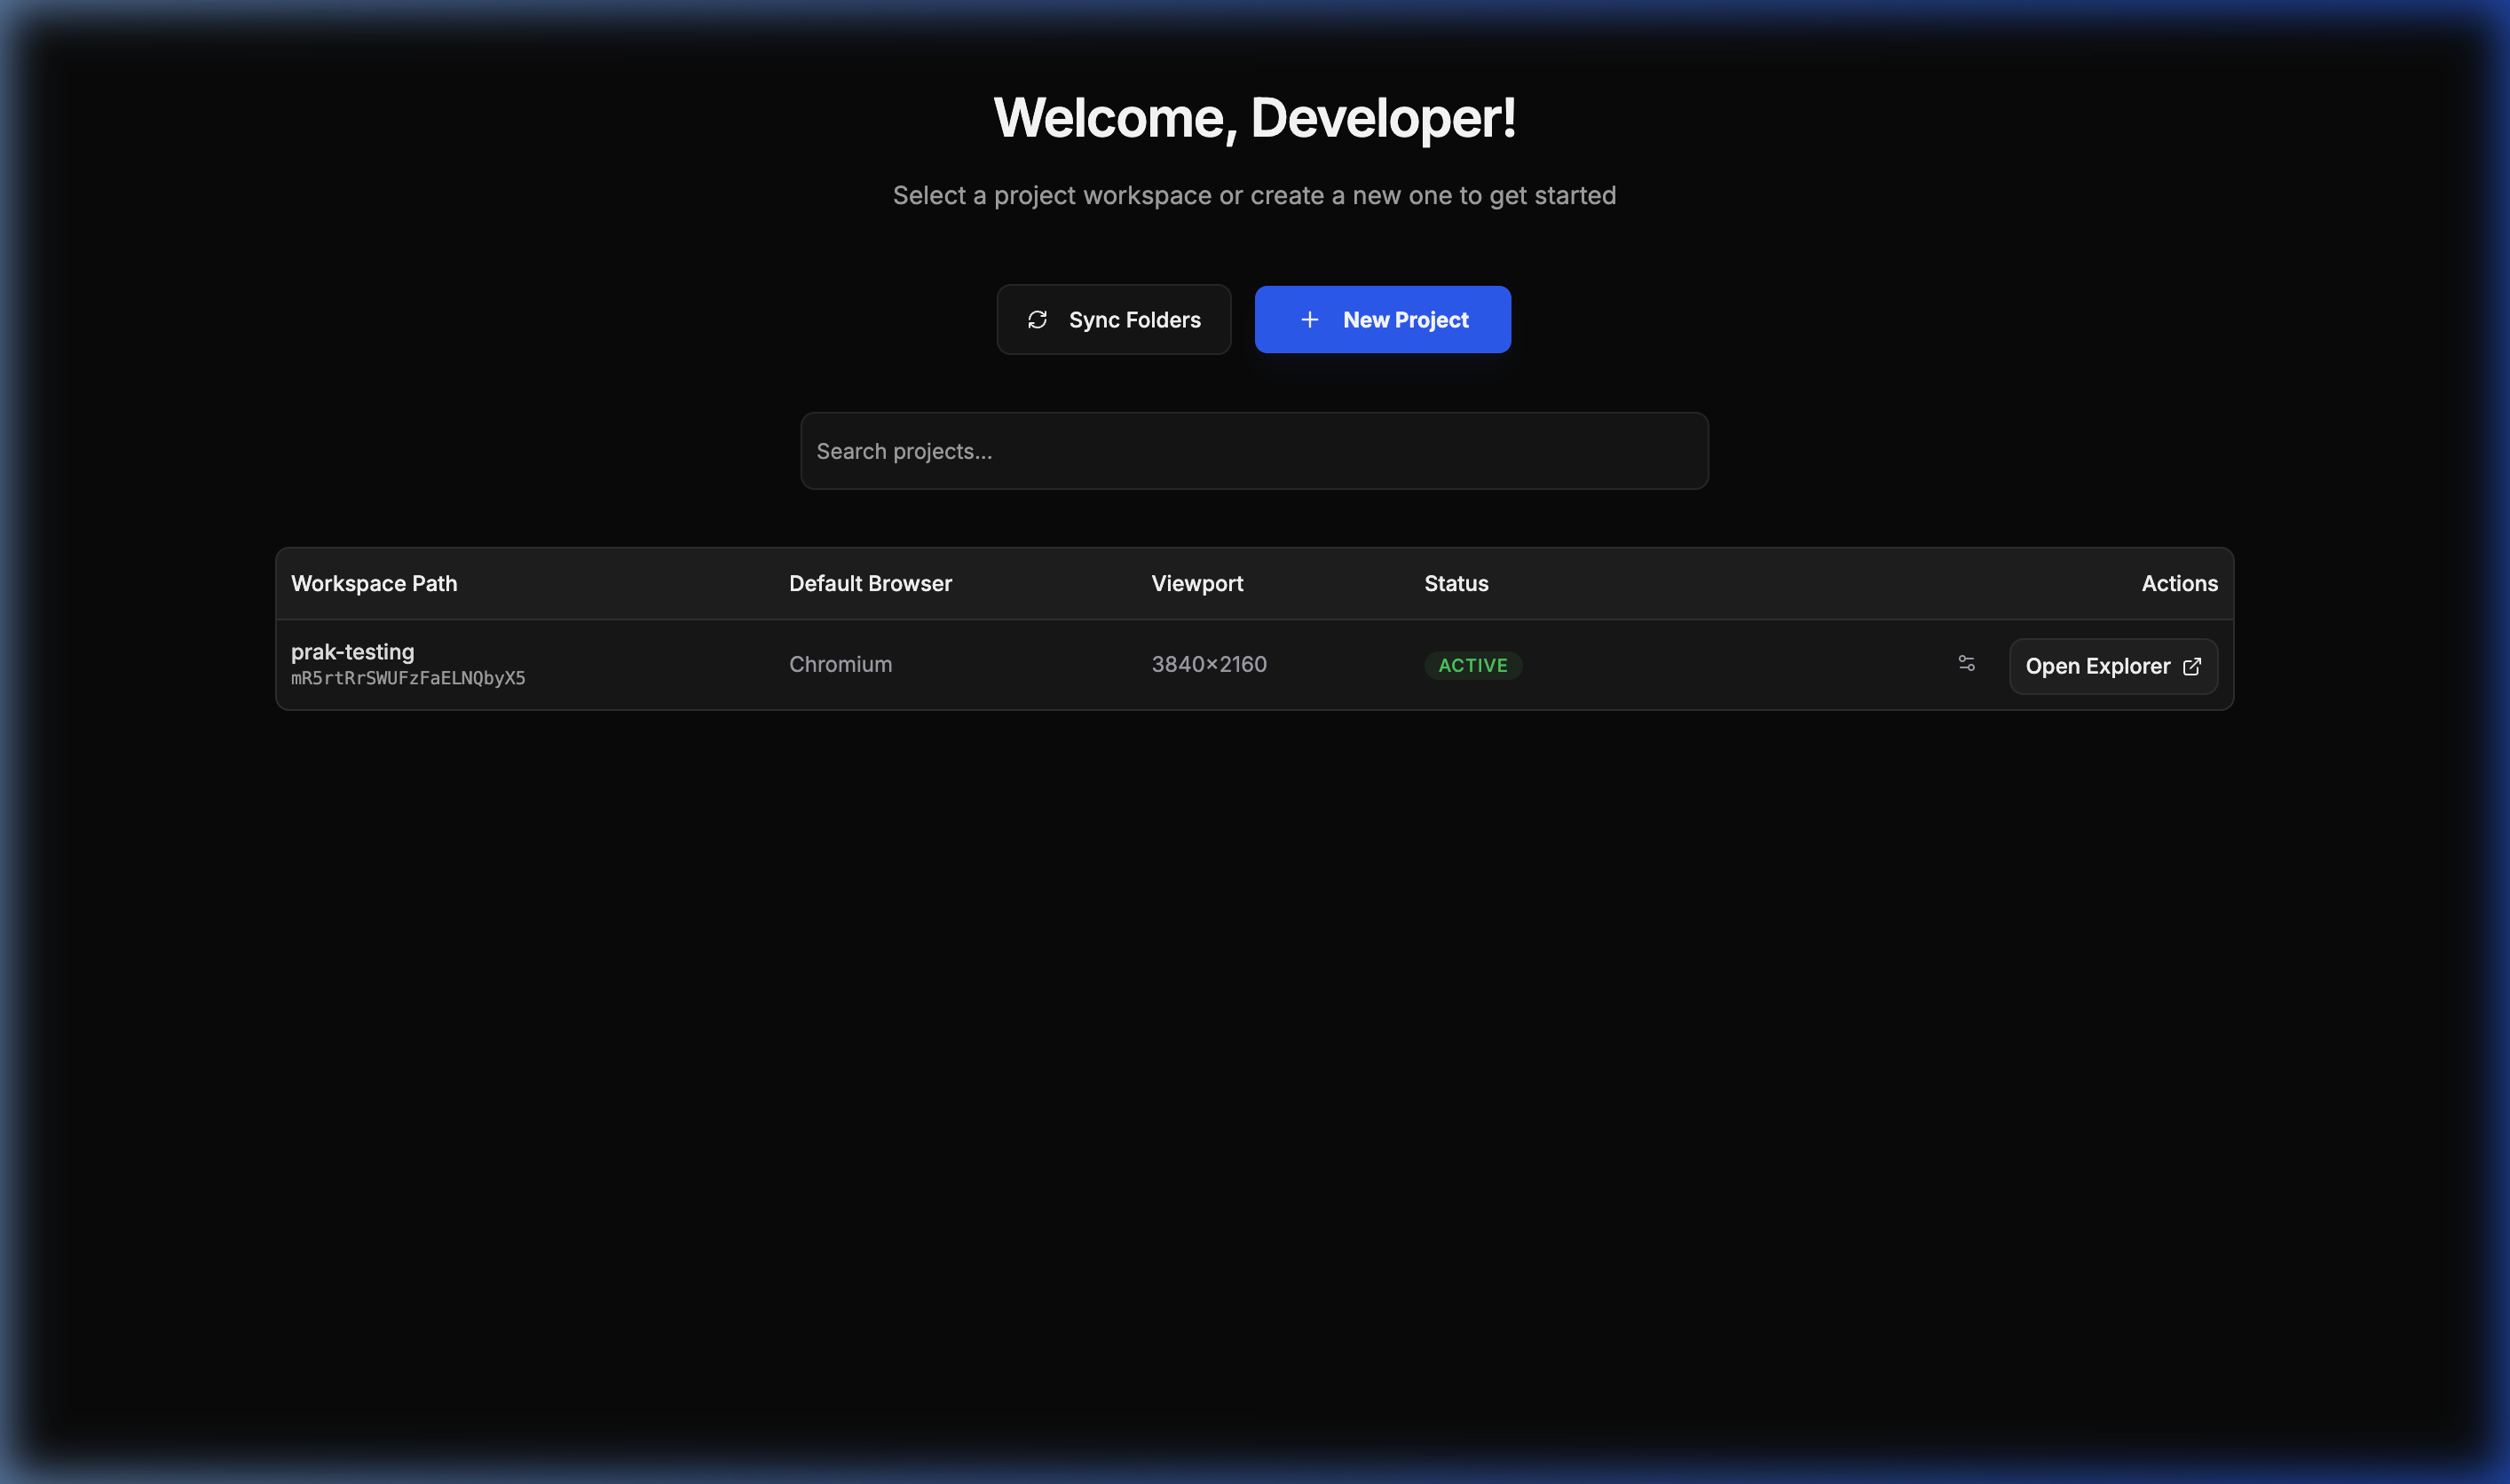
📂 Project Workspace
A bird’s-eye view of all your integrated Playwright projects.
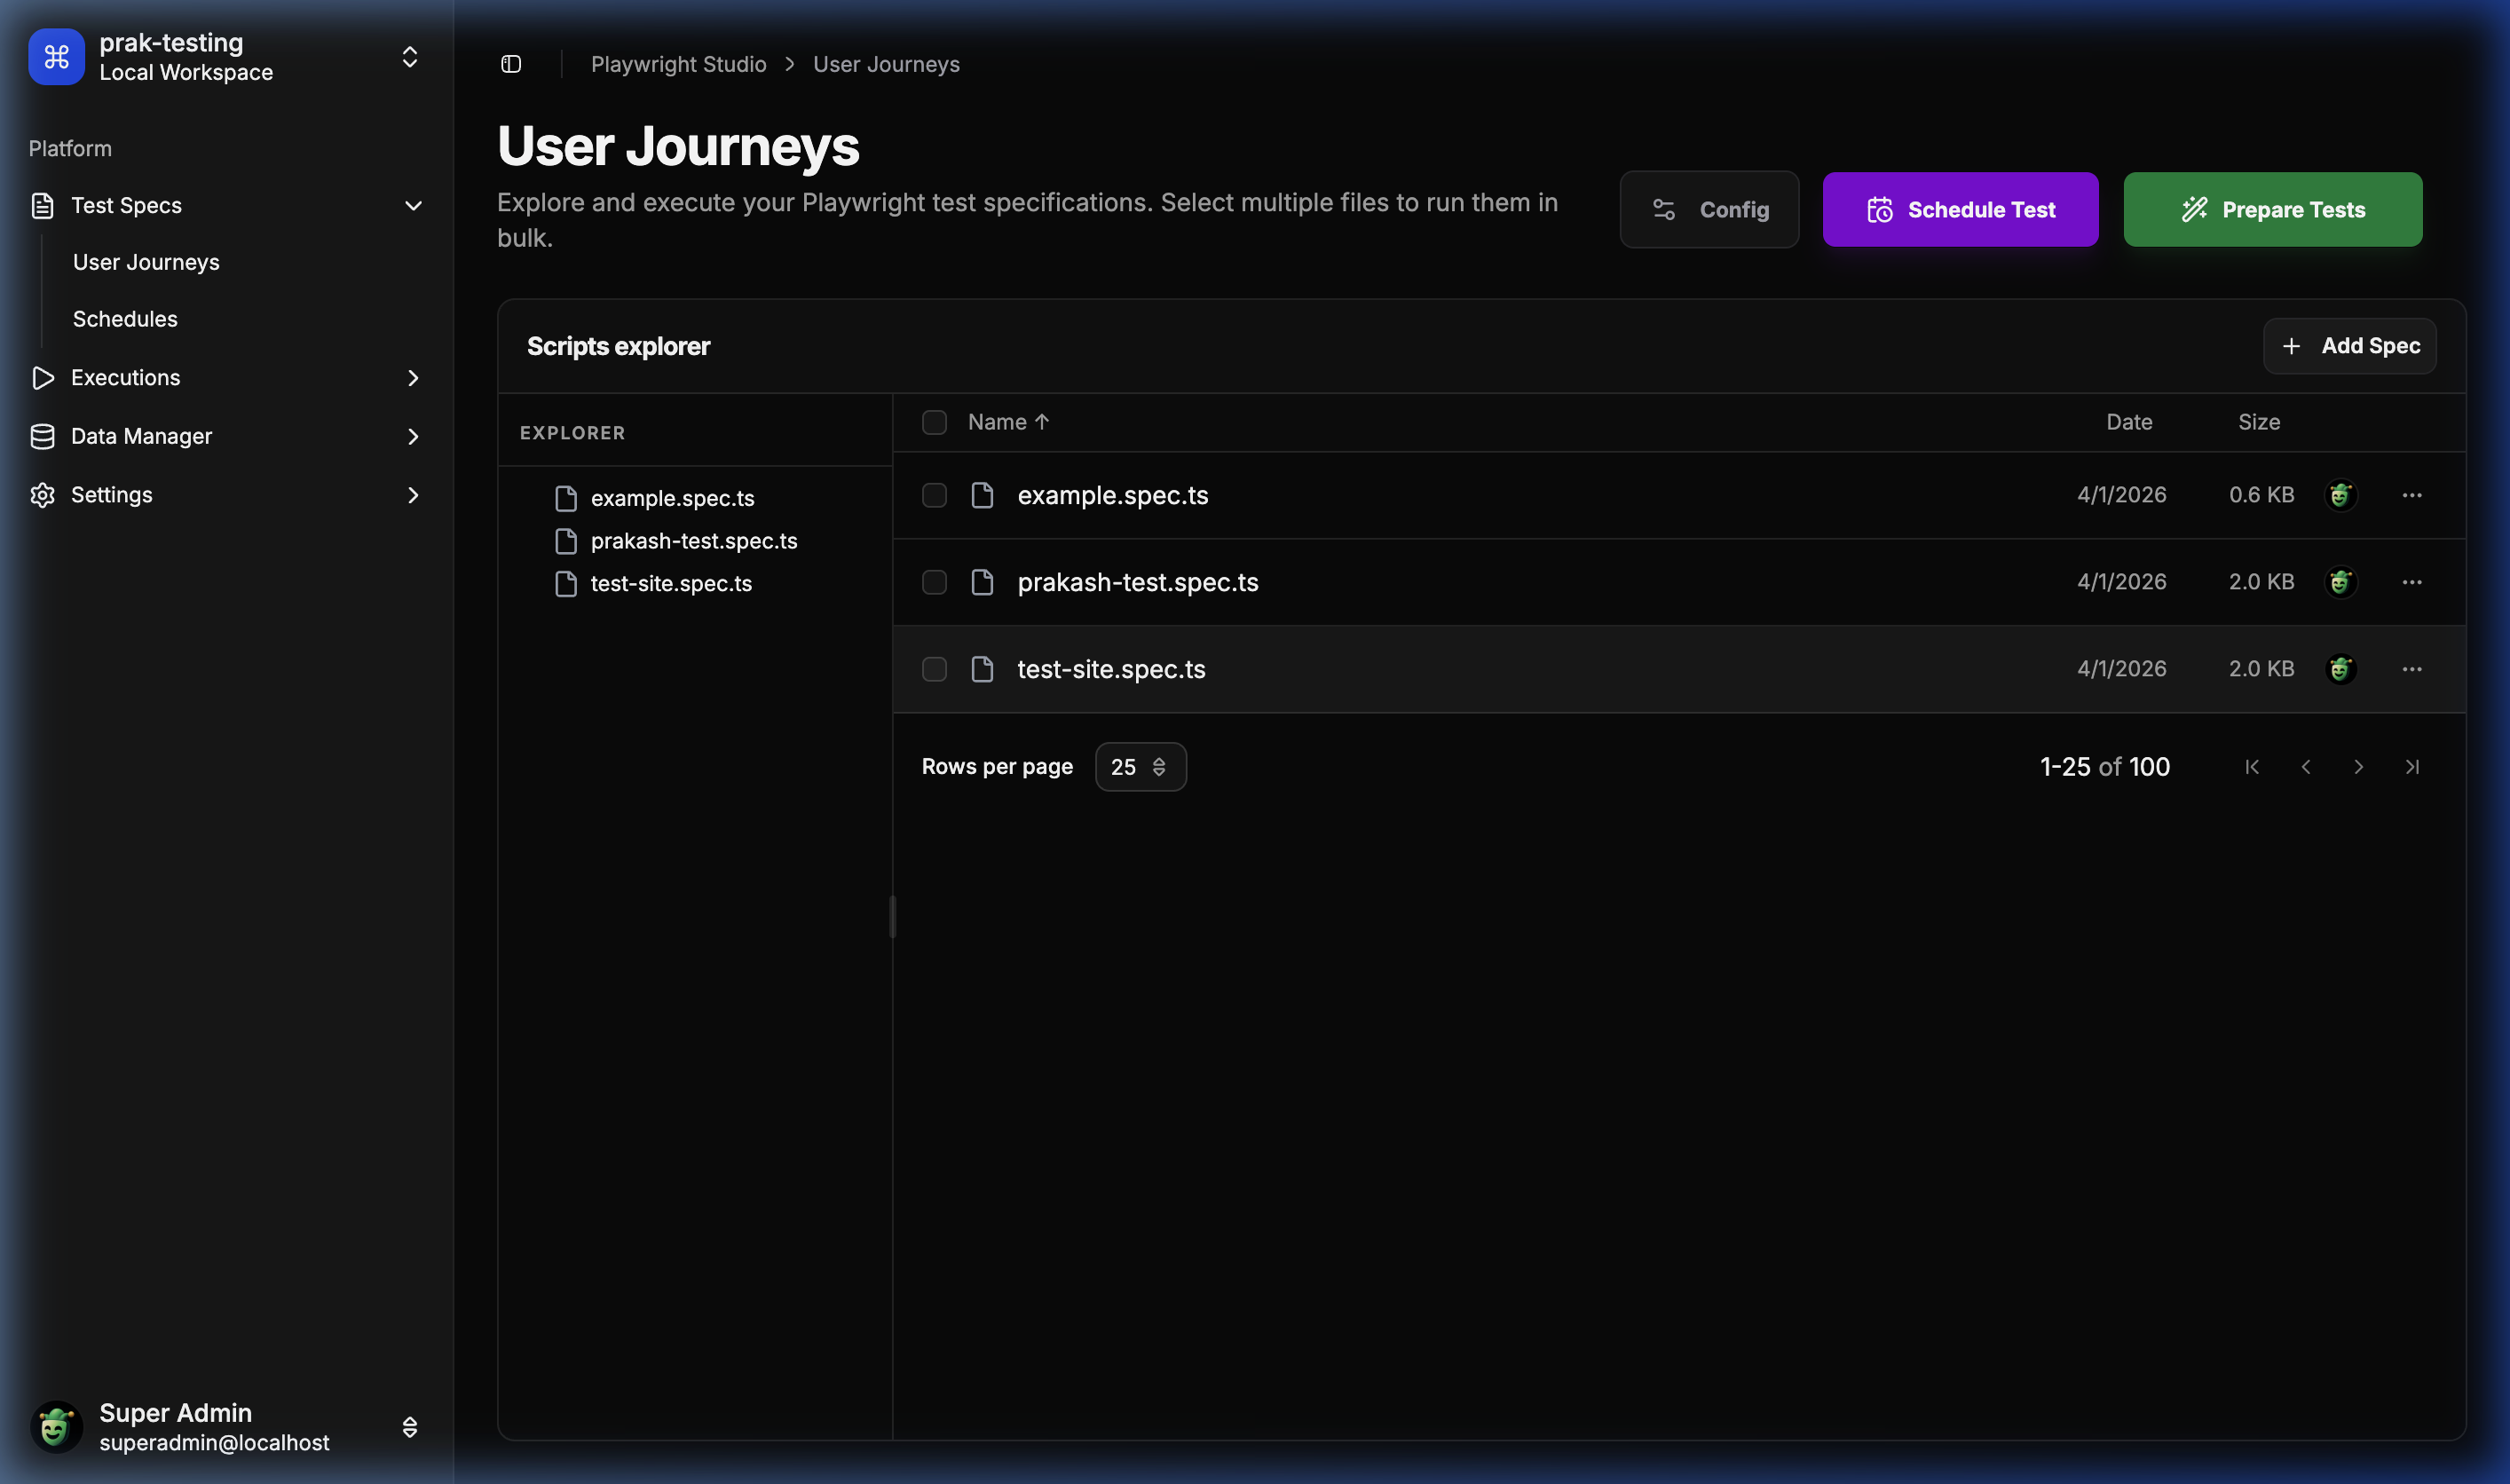
🔍 User Journey Explorer
The central hub for browsing and managing test specifications.
🧪 Runner & Prepare
Interactive drawer for preparing and selecting tests for execution.
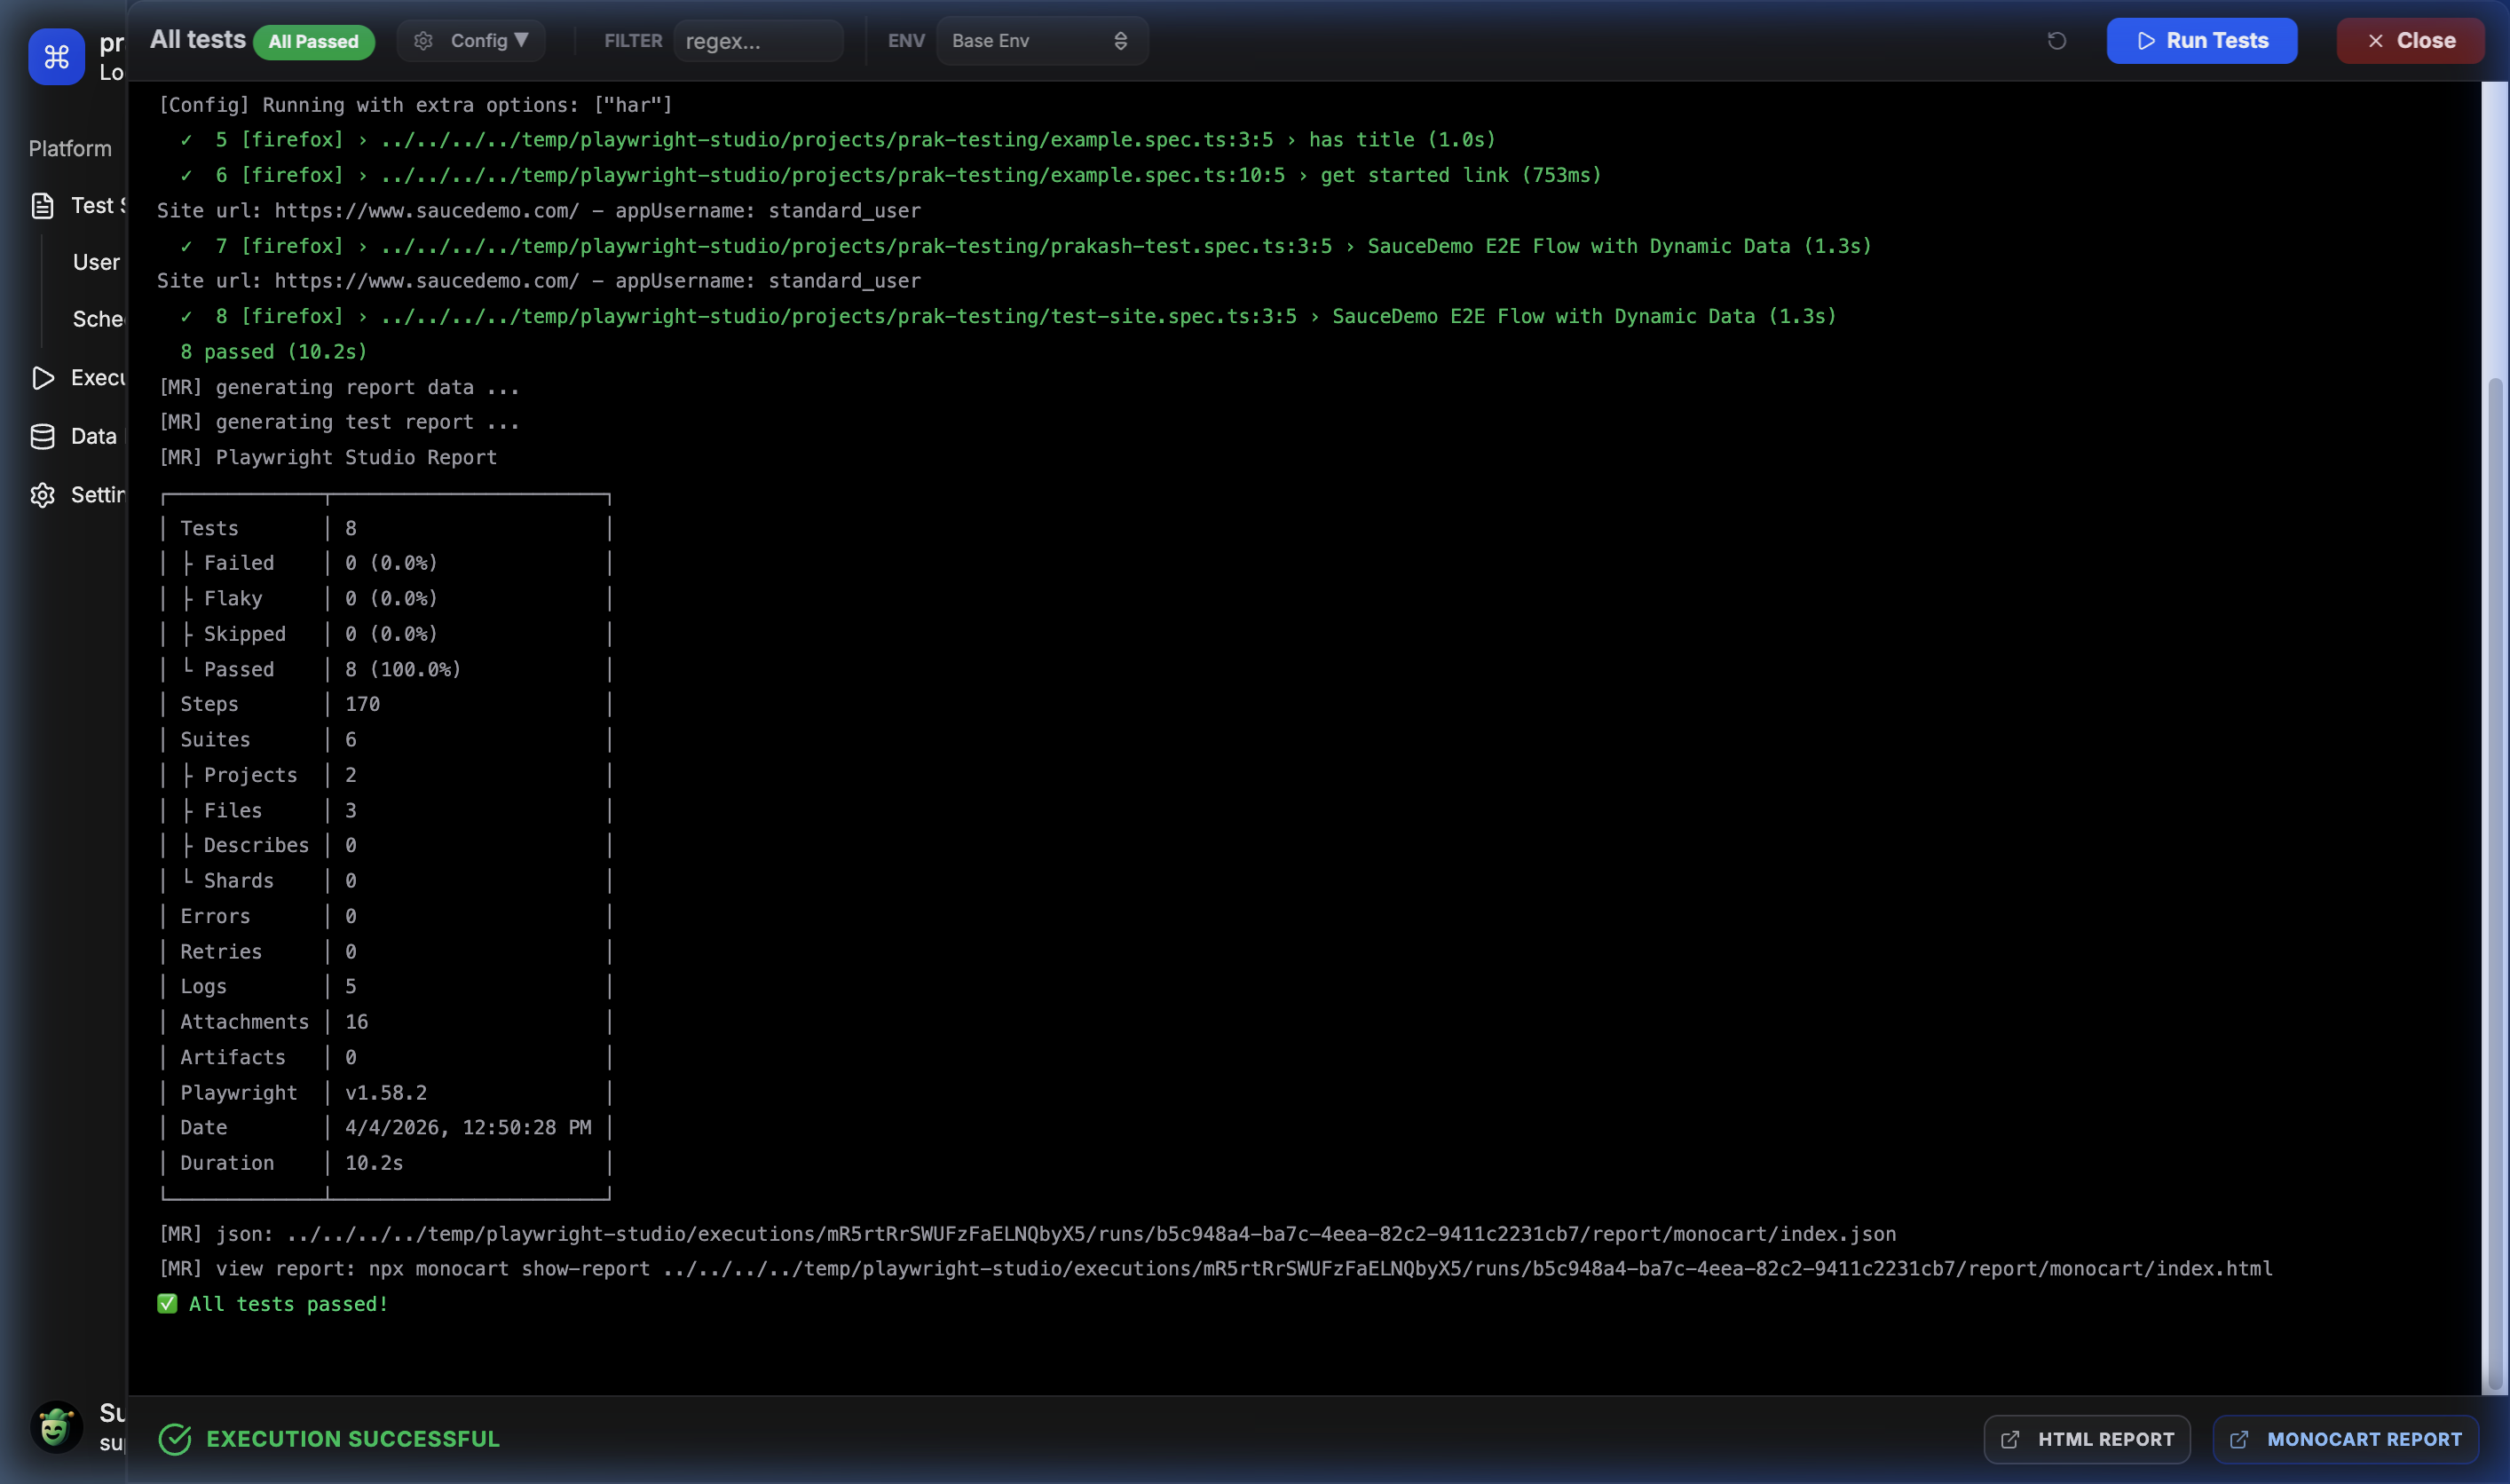
⚡ Live Execution Logs
Real-time feedback and execution logs for parallel test runs.
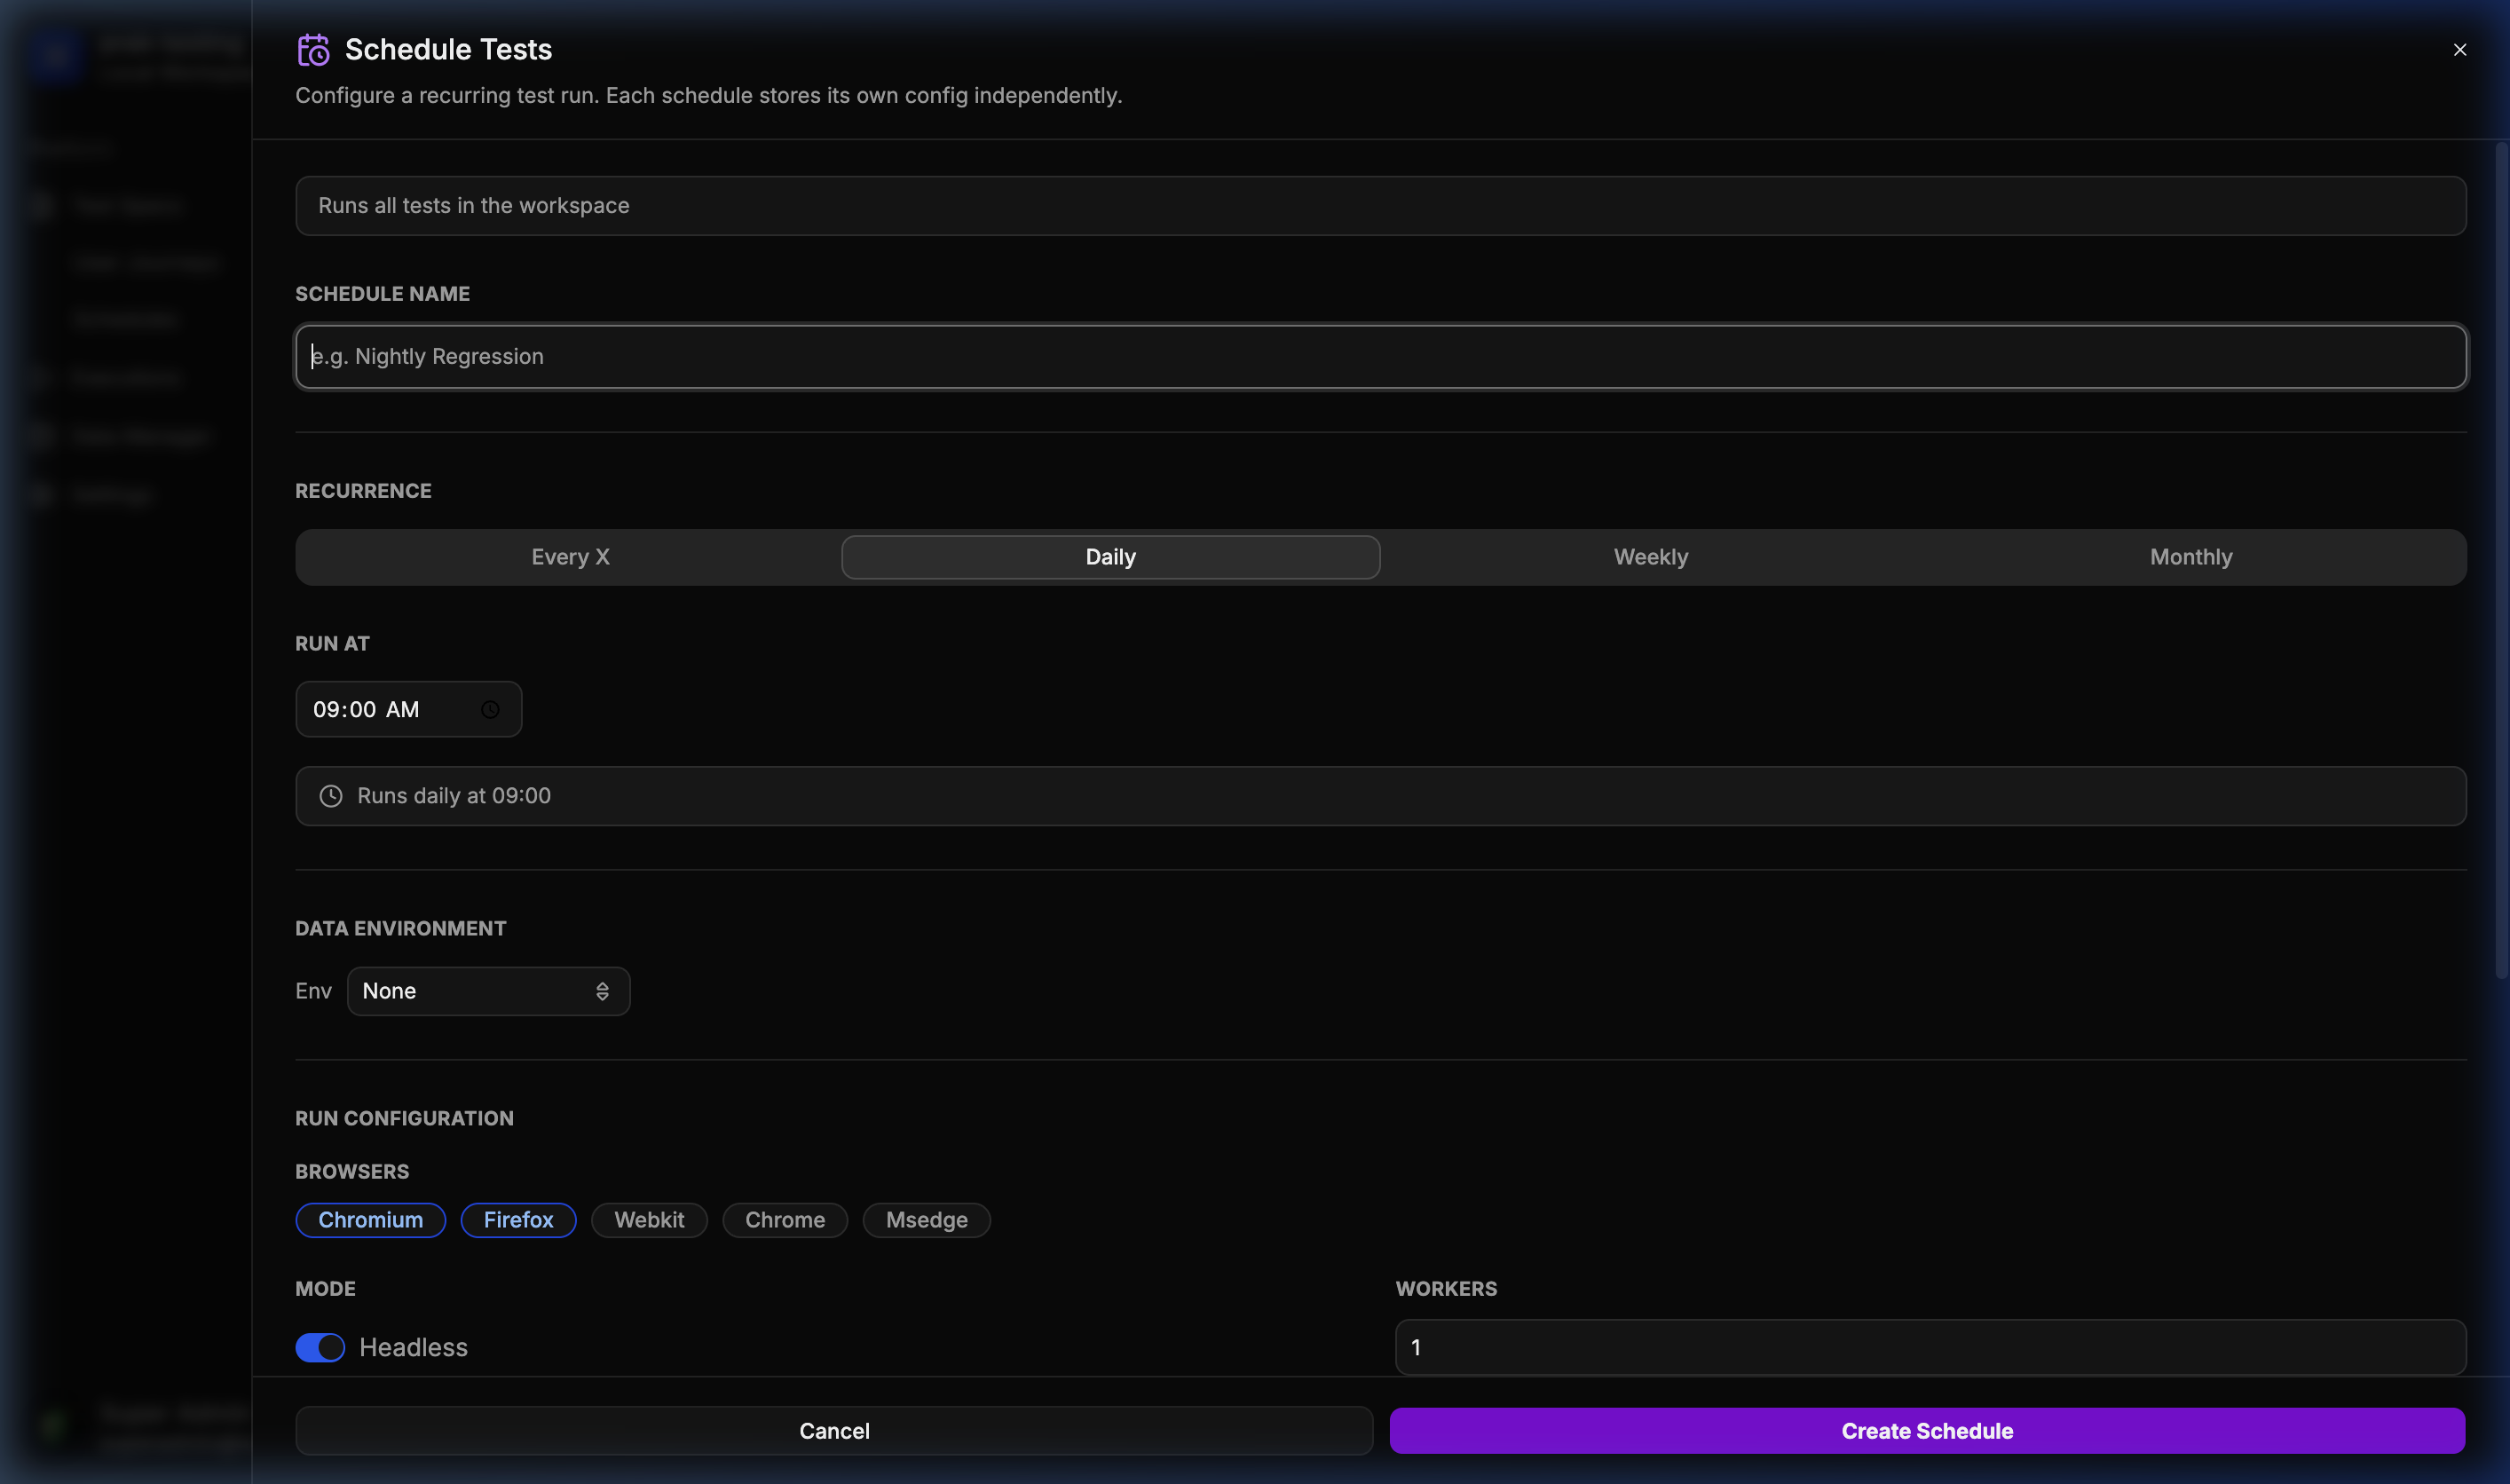
📅 Advanced Scheduler
Easily configure recurring test runs for continuous monitoring.
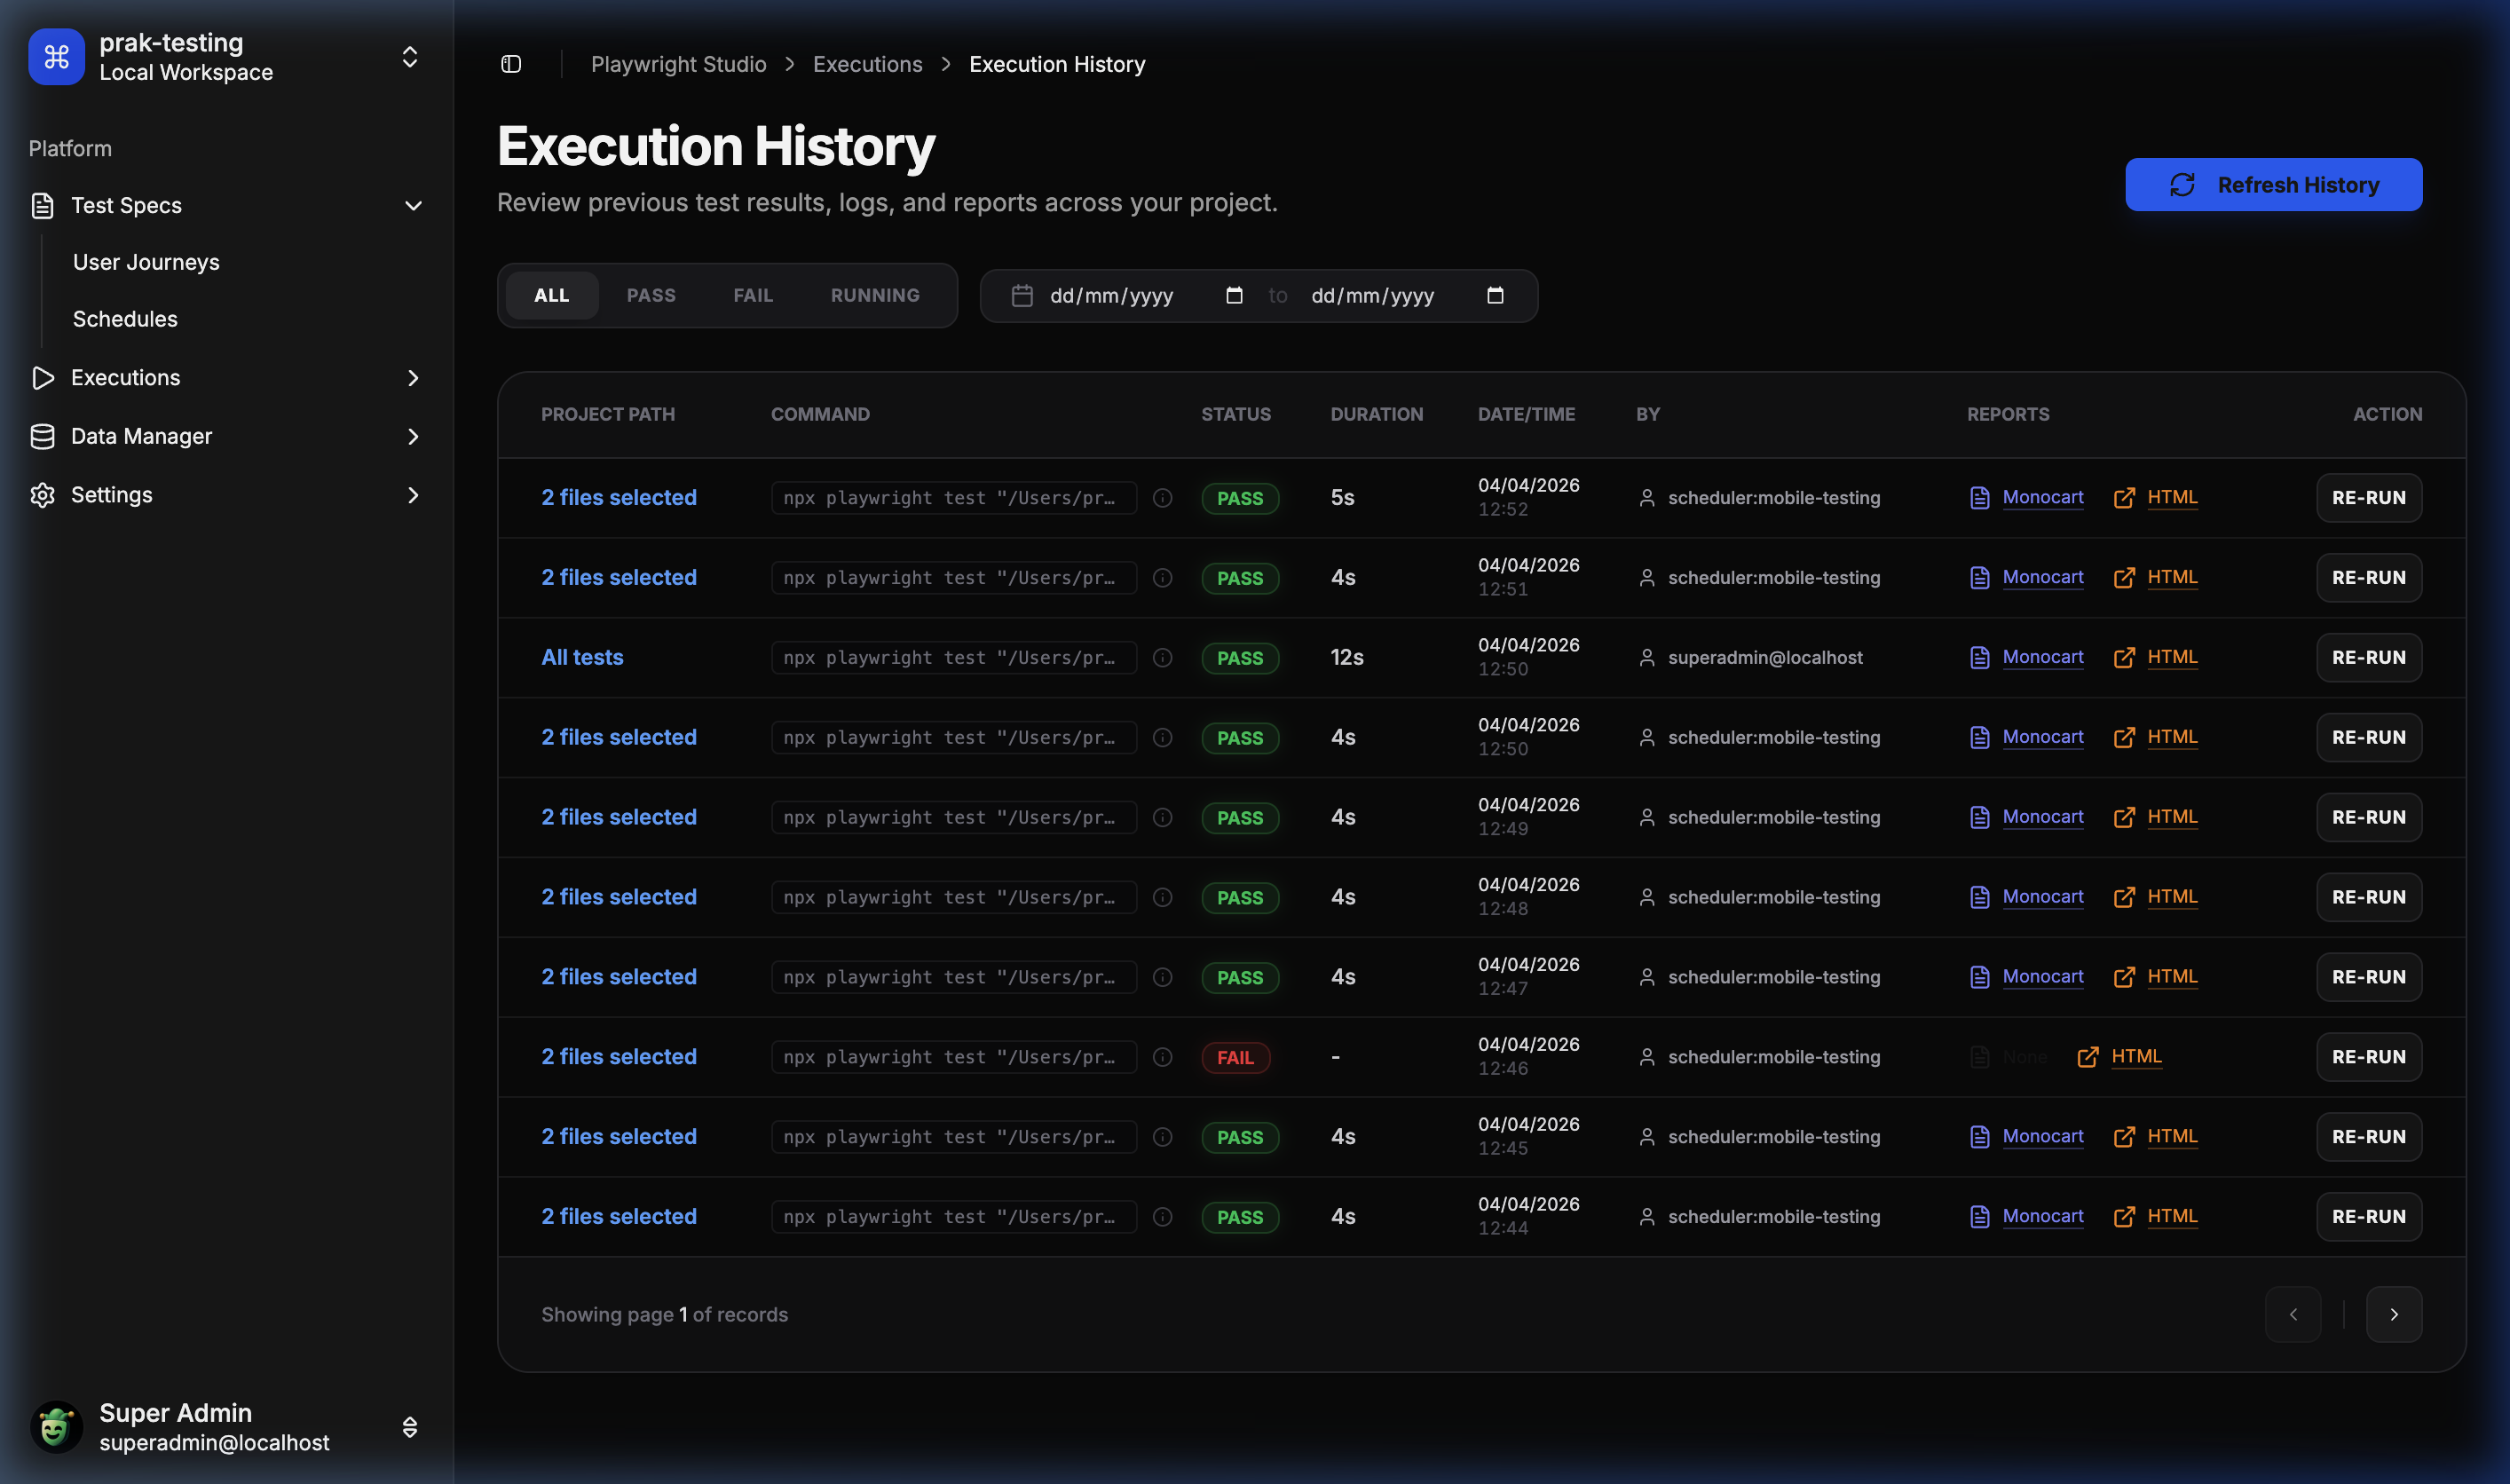
📊 Historical Run Analytics
Complete history of every execution with direct access to HTML reports.
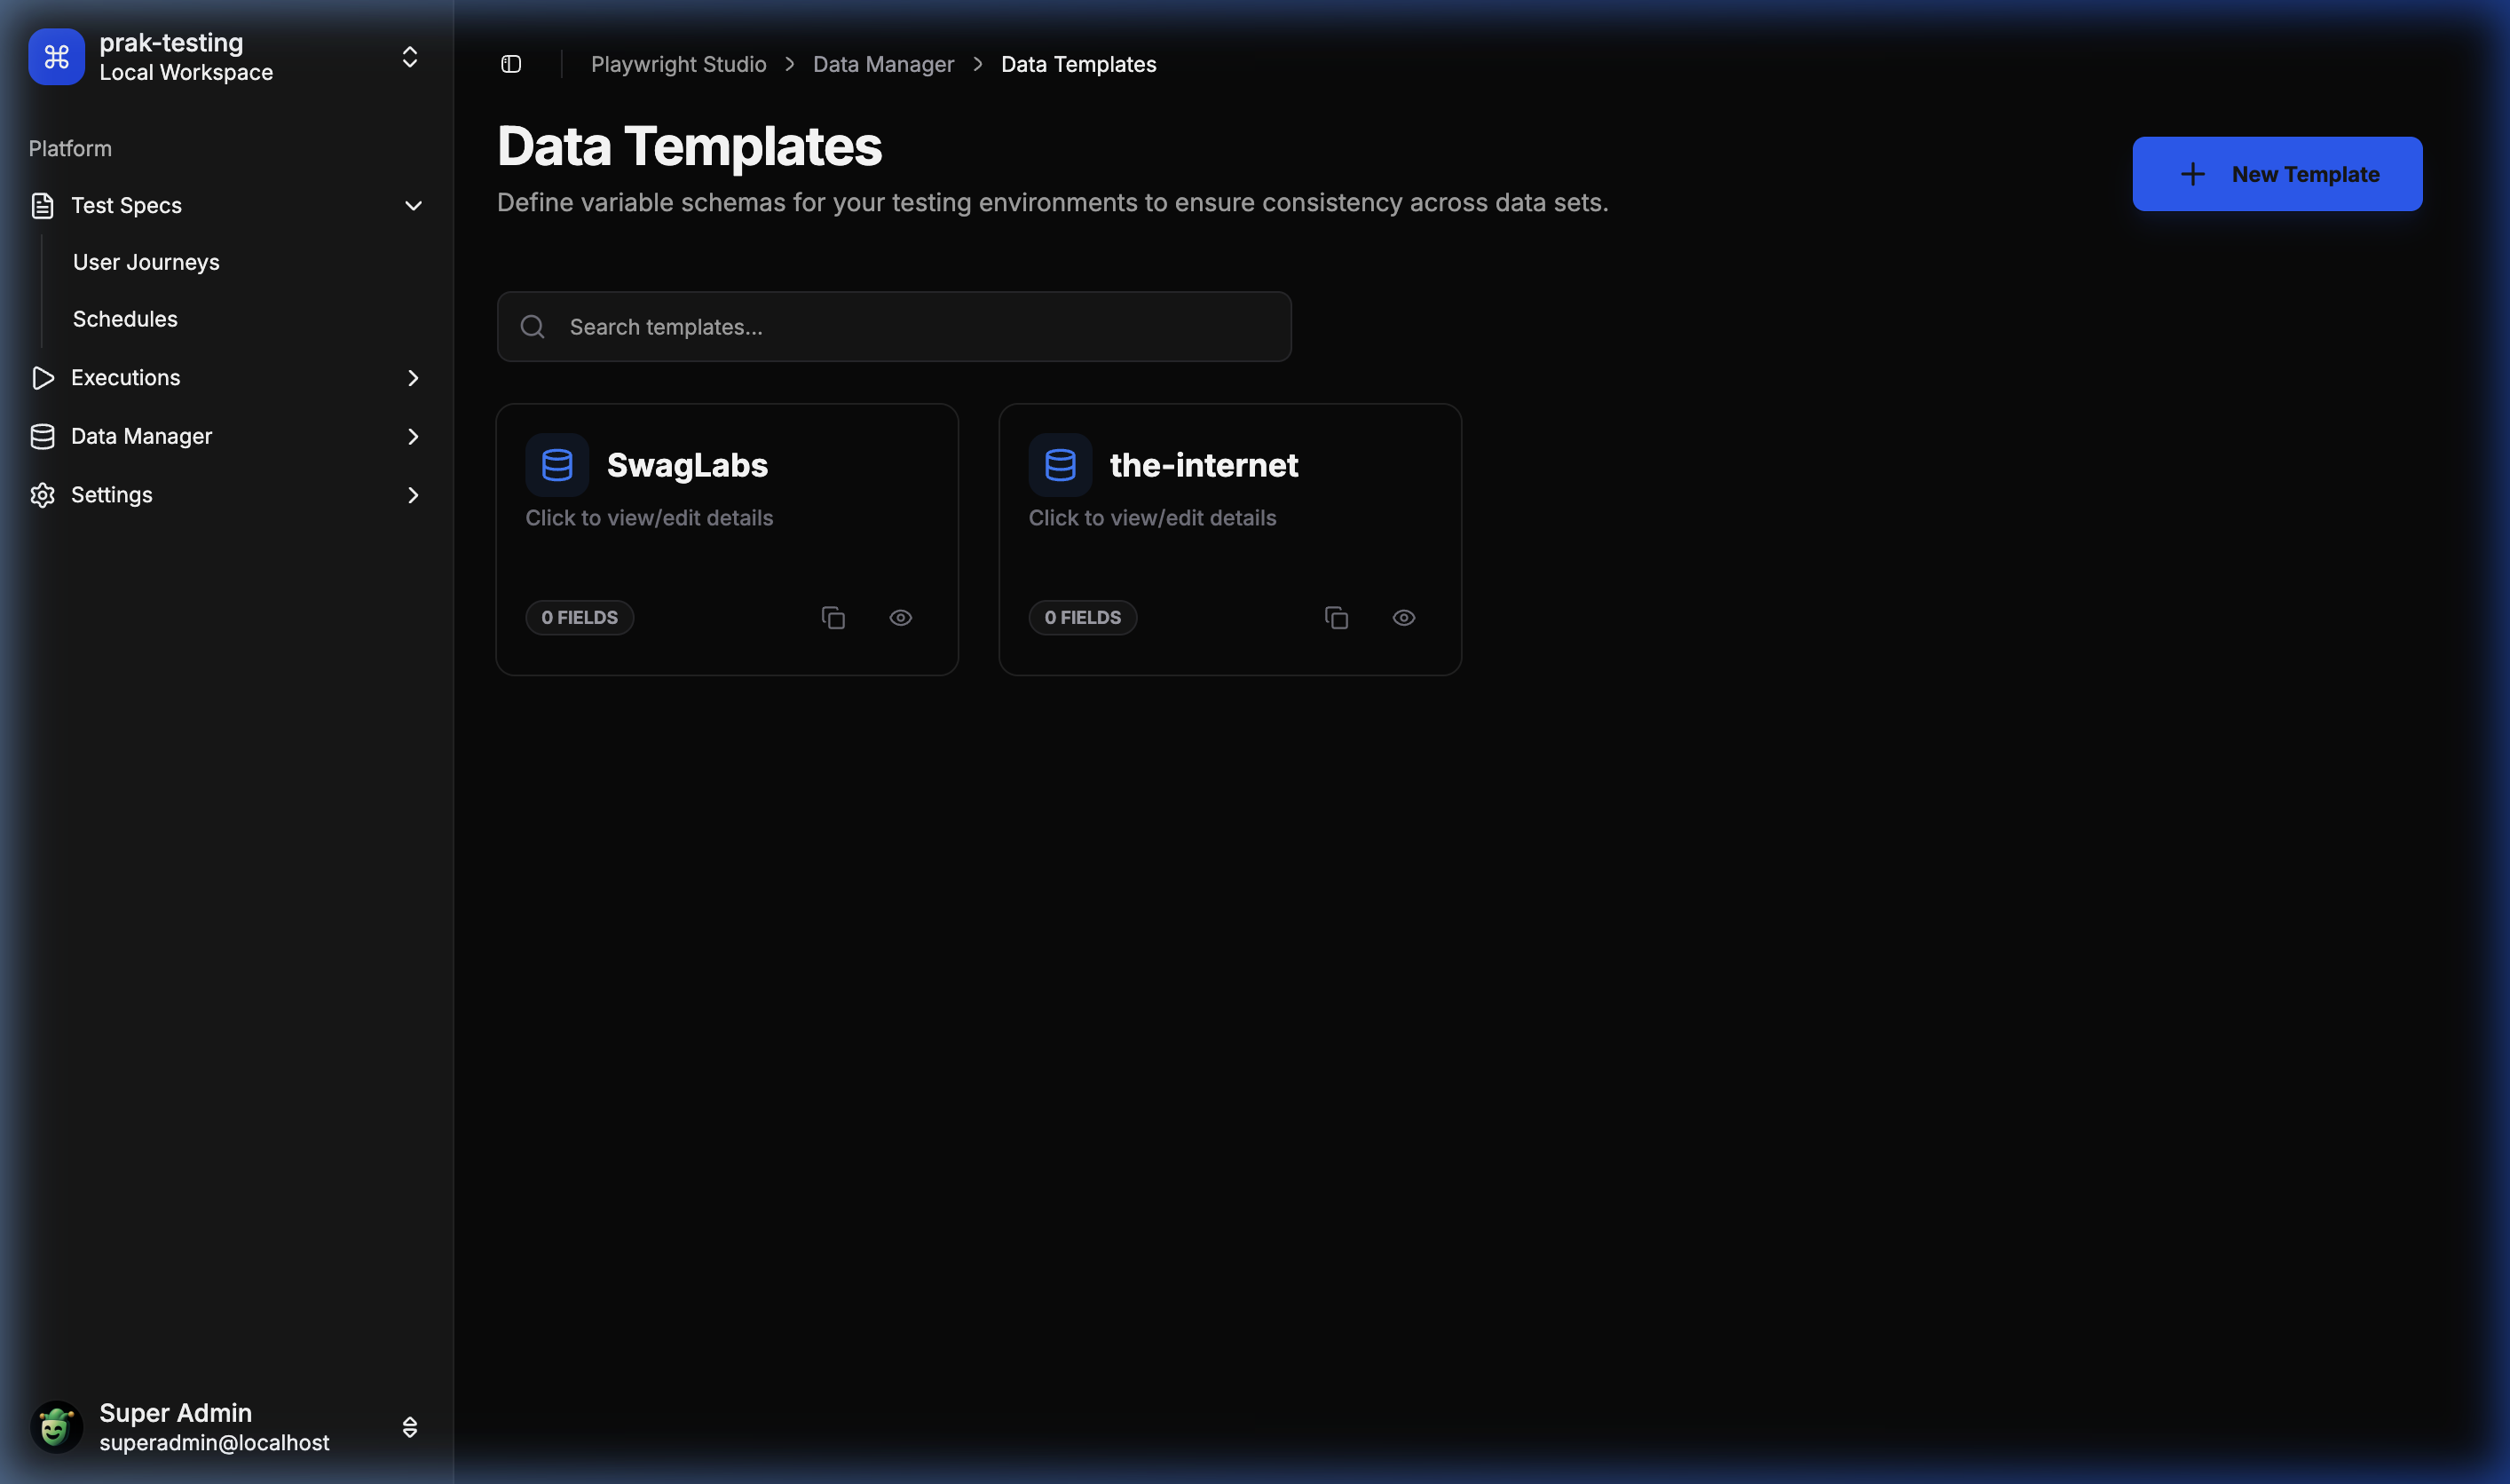
📦 Data Manager – Templates
Define schema-based data templates for your user journeys.
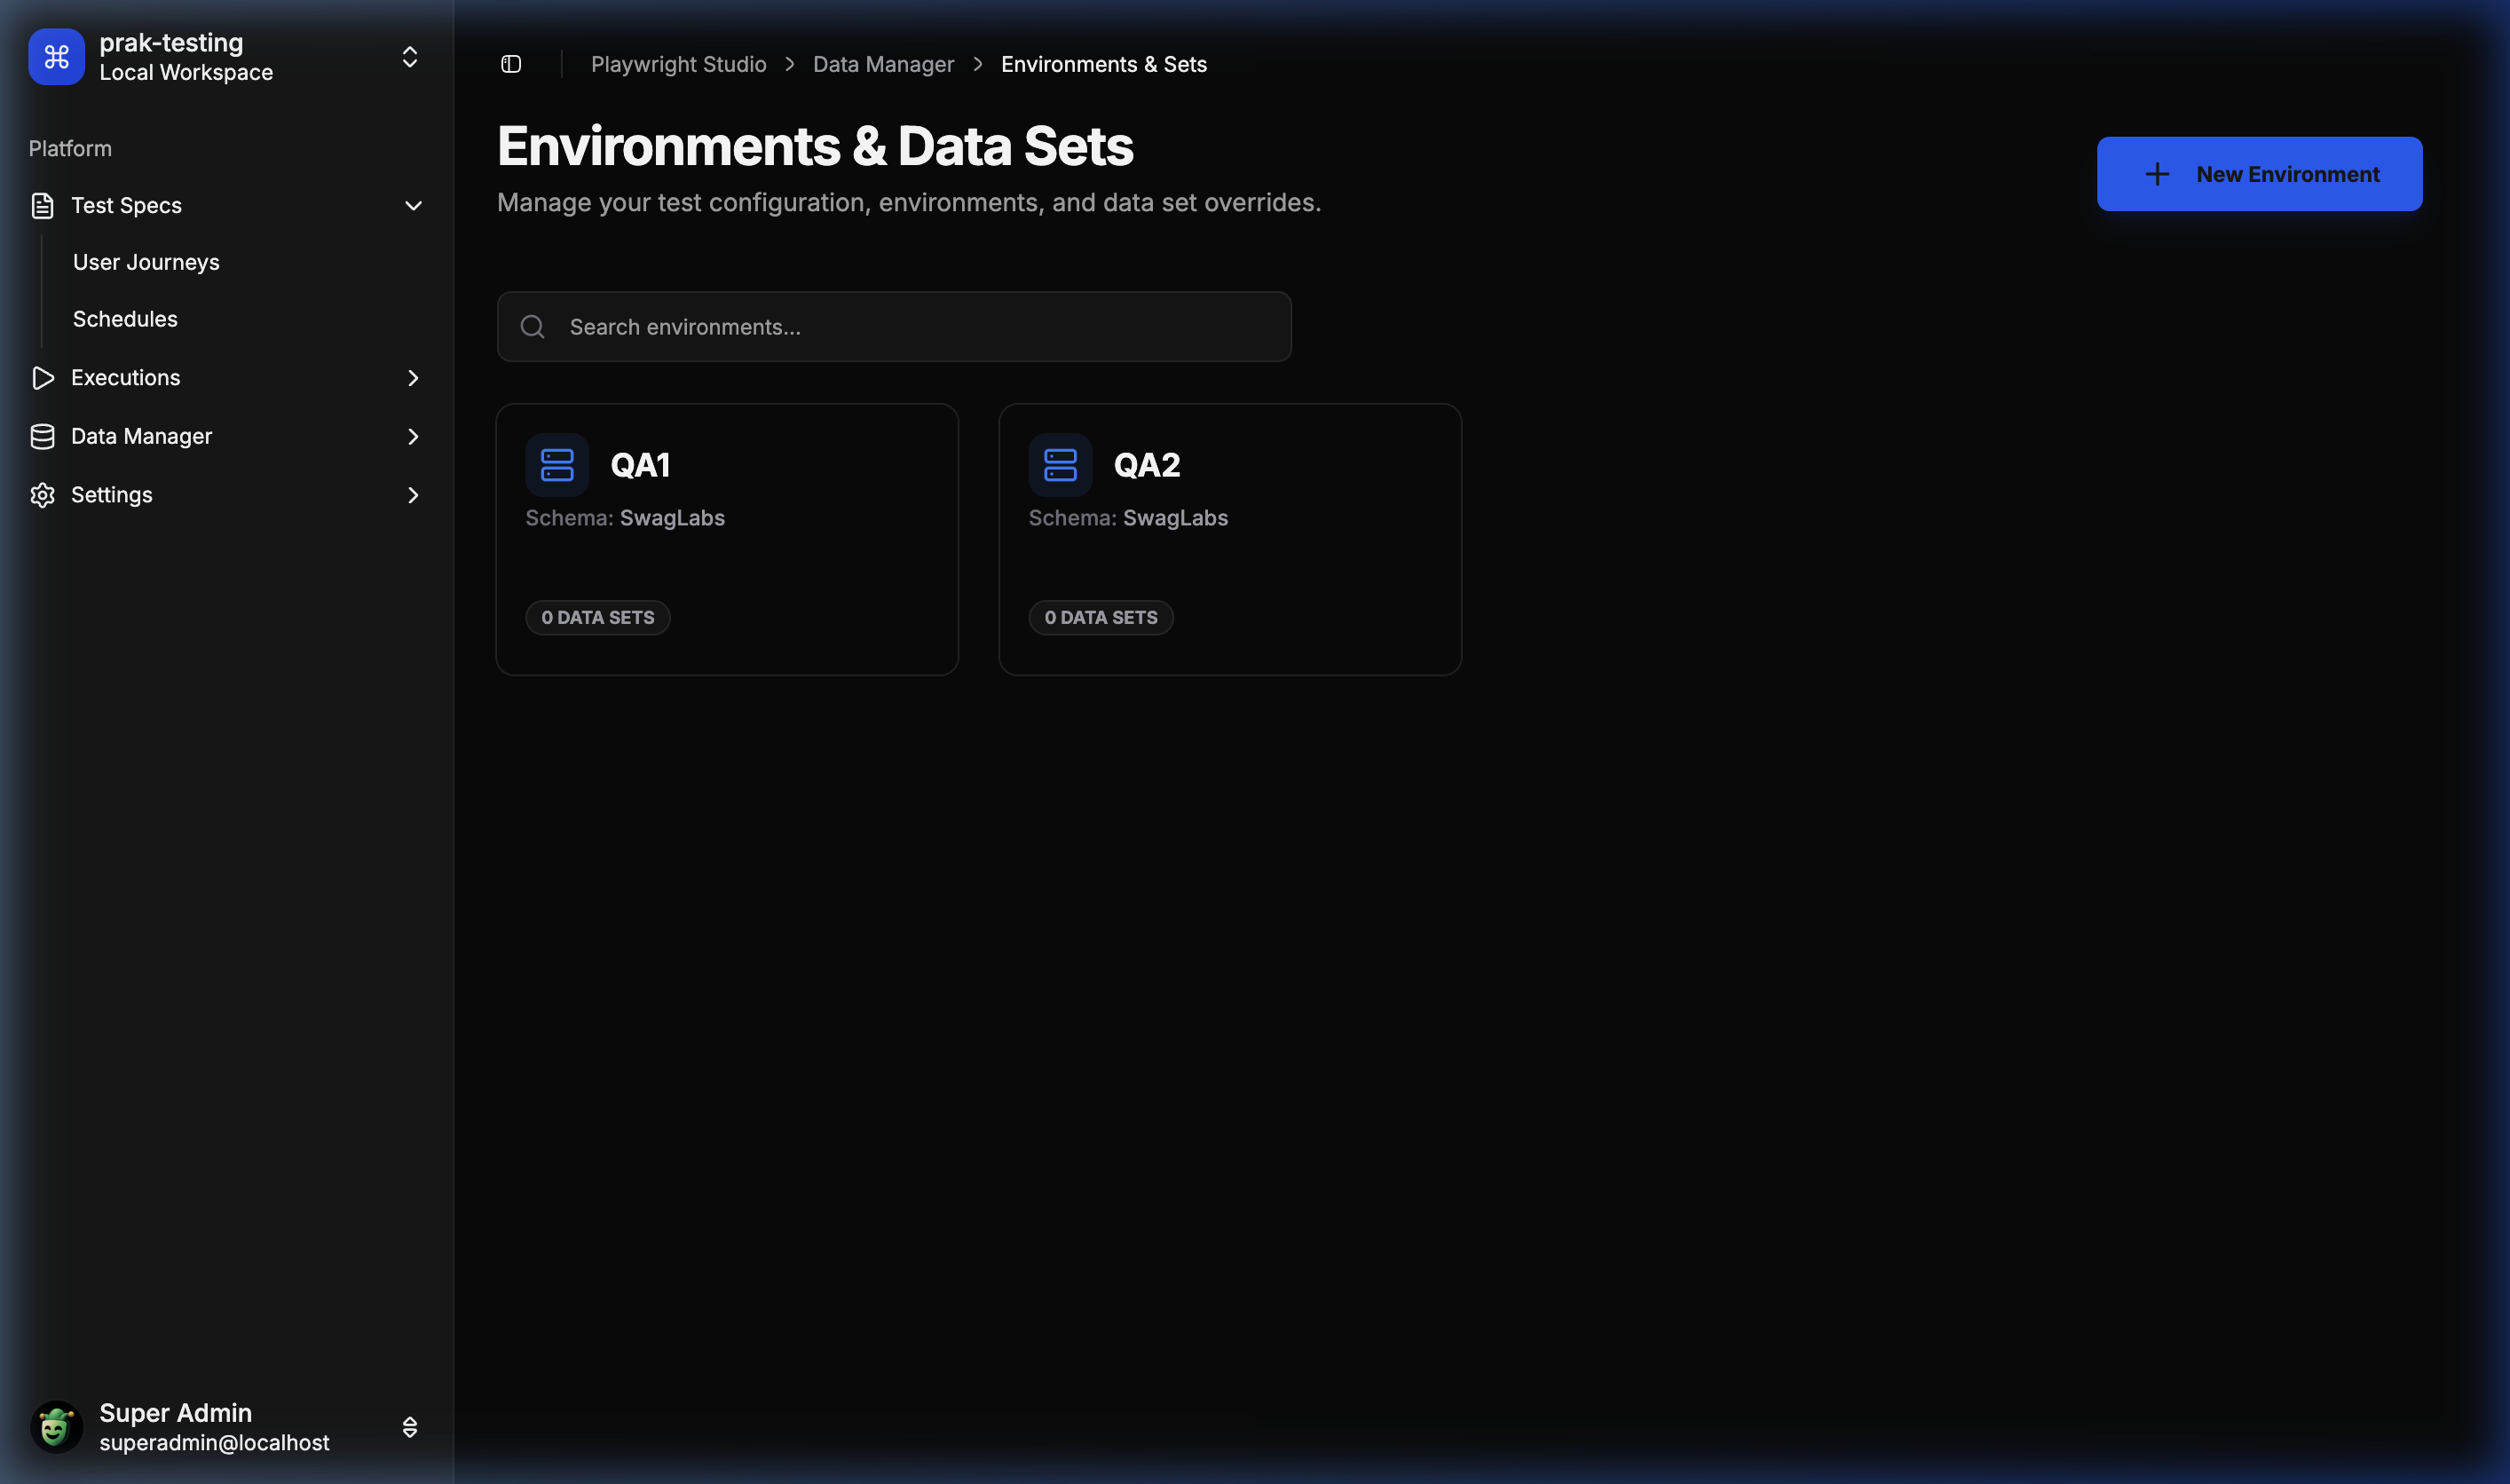
🌐 Environment & Datasets
Manage environment-specific data overrides effortlessly.
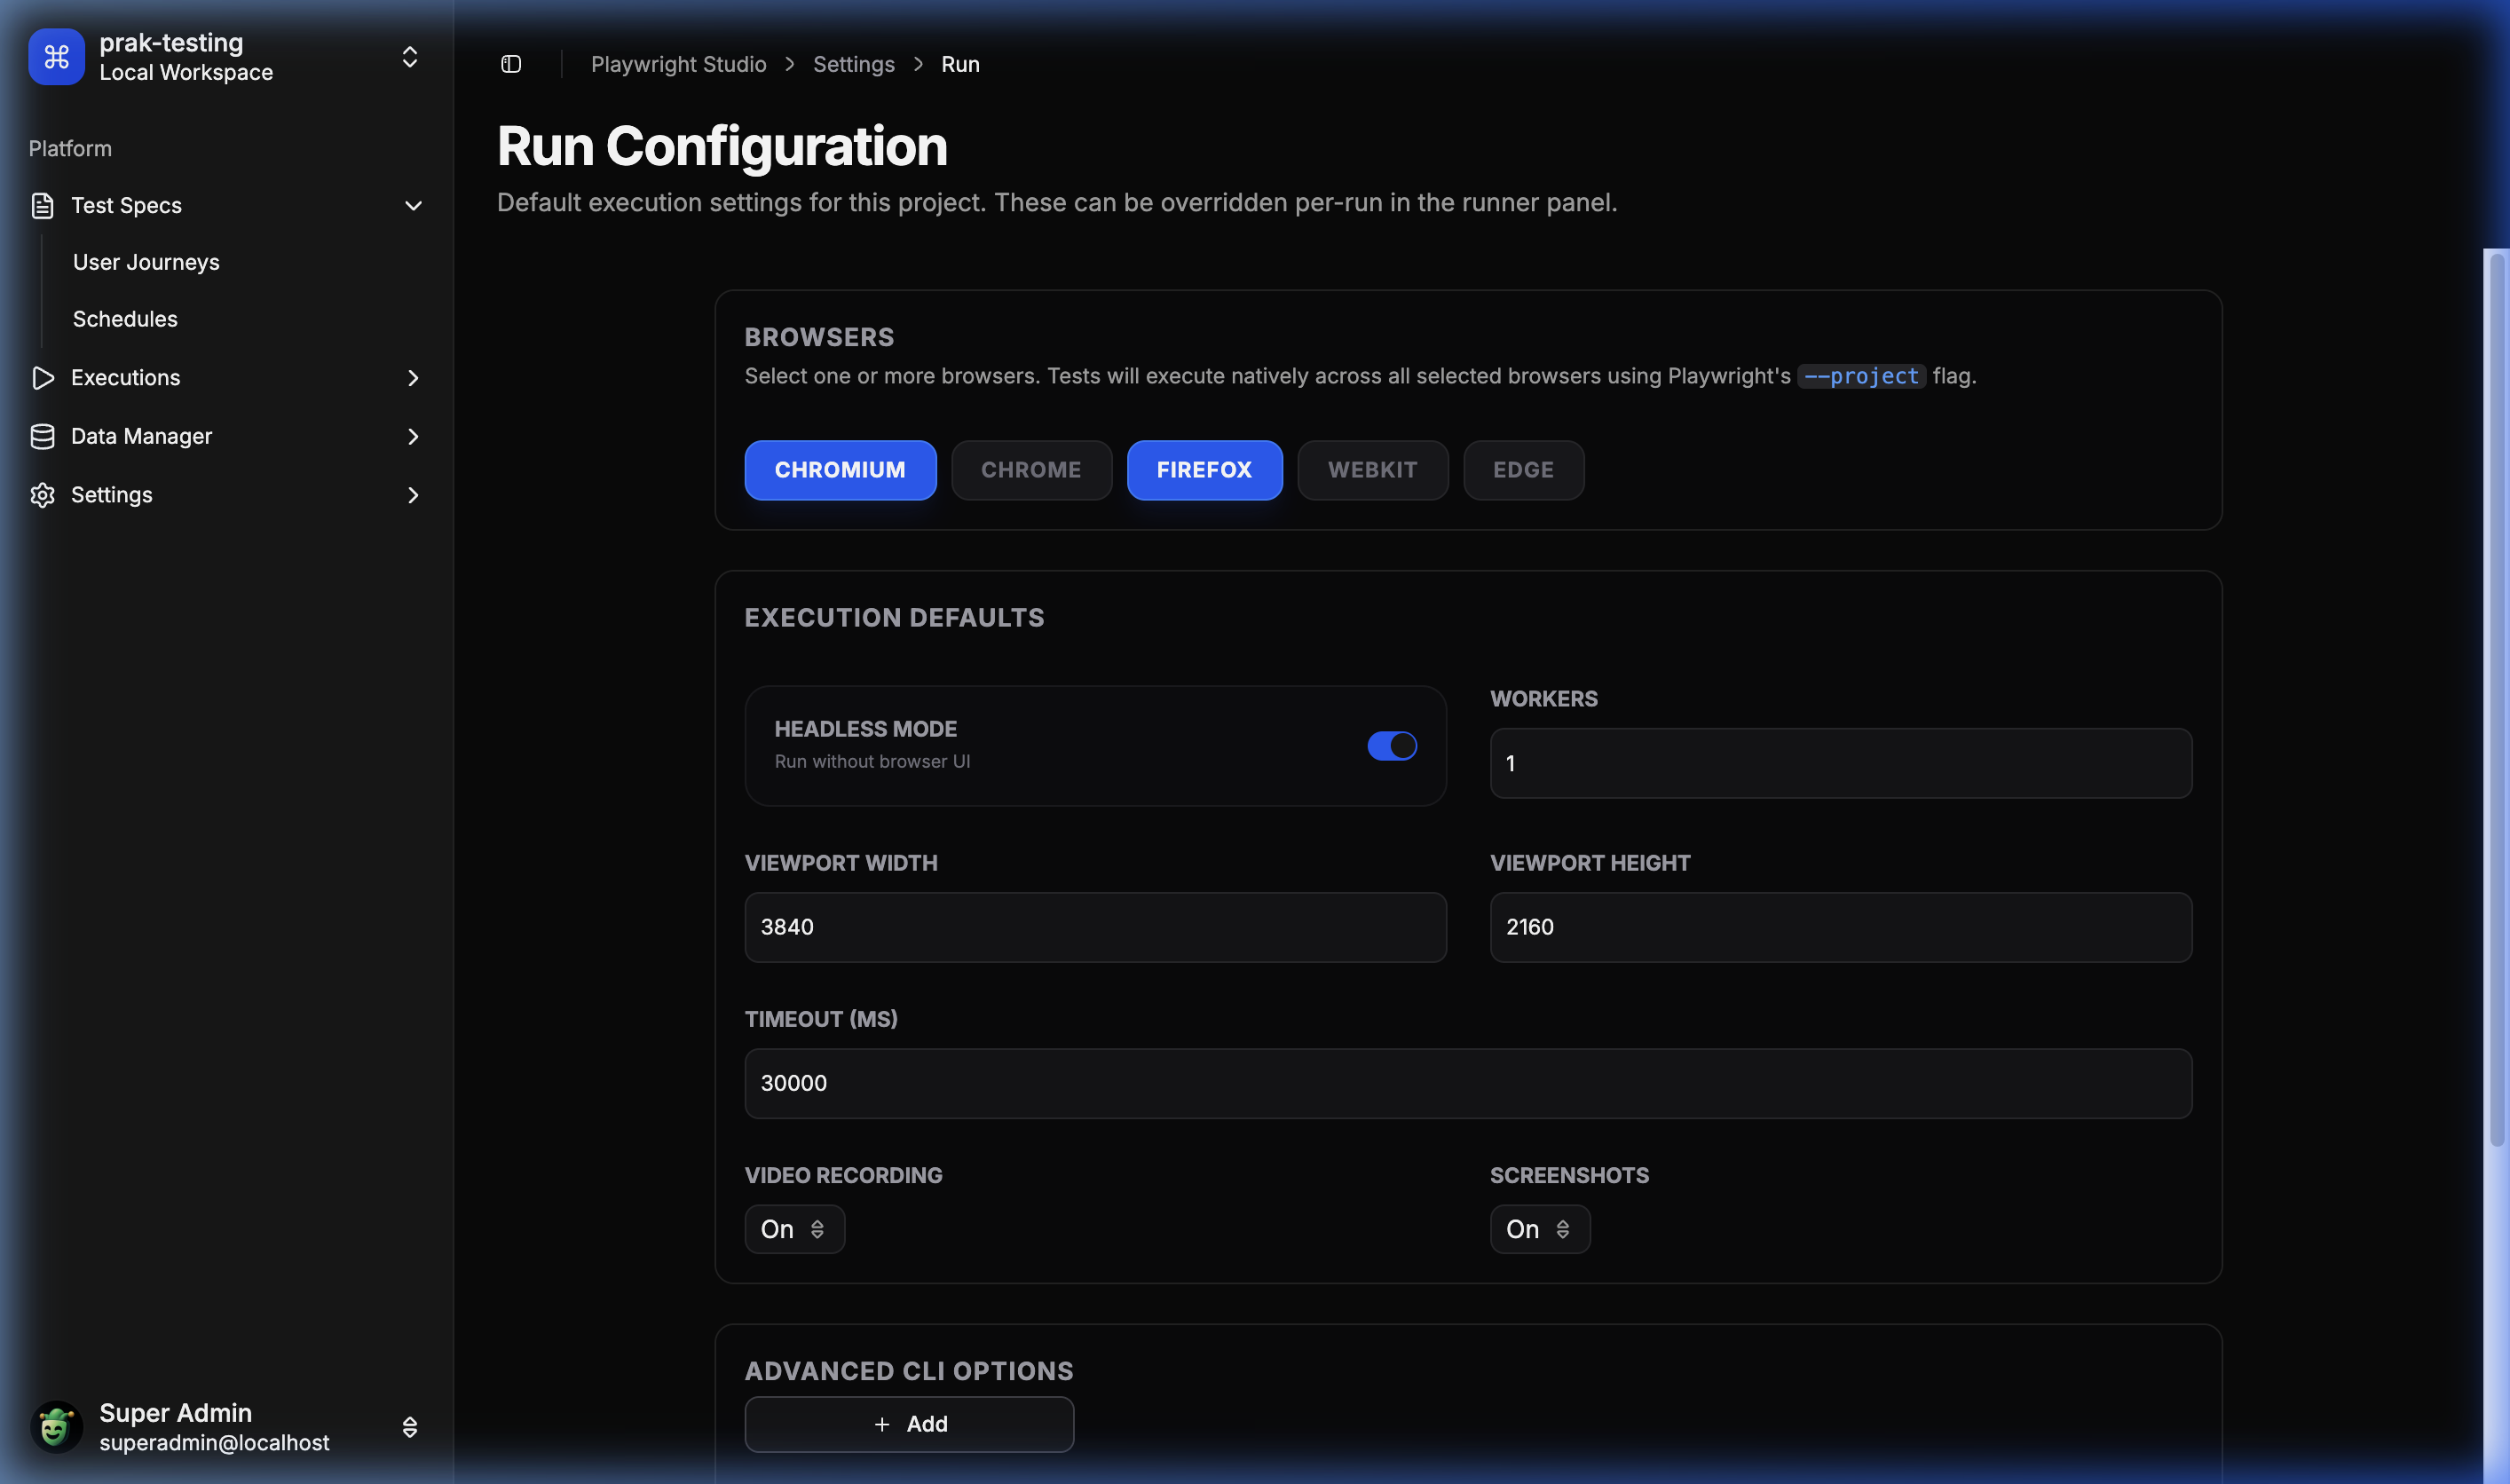
⚙️ Global Configuration
Fine-tune project-level Playwright settings from the UI.
🛠️ Tech Stack
- Frontend: React 18, Vite, Tailwind CSS, Lucide Icons, Radix UI (Shadcn), Monaco Editor.
- Backend: Node.js, Express, TypeScript.
- Database: SQLite (via
better-sqlite3), Drizzle ORM. - Execution: Playwright (Core Engine).
- Communication: WebSockets (Real-time logs) & REST API.
🚀 Getting Started
Quick Start with Docker
The fastest way to try ITG Playwright Studio is via Docker:
docker pull ghcr.io/itechgenie/itg-playwright-studio:latest

docker run -d \
  -p 3000:3000 \
  -v $(pwd)/data:/app/data \
  --name itg-playwright-studio \
  ghcr.io/itechgenie/itg-playwright-studio:latest
Then open http://localhost:3000 in your browser.
Note: The
-v $(pwd)/data:/app/datamount persists your projects, executions, and database across container restarts.
Prerequisites
- Node.js: v18 or later.
- Playwright Dependencies: Ensure browsers are installed (
npx playwright install).
Setup
-
Clone the repository:
git clone https://github.com/ITEchGenie/playwright-studio.git -
Install Dependencies:
npm install -
Configure Environment: Create a
.envfile inplaywright-studio/server:PORT=3000 PROJECTS_BASE_PATH=D:/tmp/playwright-studio/projects EXECUTIONS_BASE_PATH=D:/tmp/playwright-studio/executions -
Configure OAuth (Optional): To enable Git integration and OAuth login, configure OAuth providers in your
.envfile:GitLab OAuth:
GITLAB_CLIENT_ID=your_gitlab_client_id
GITLAB_CLIENT_SECRET=your_gitlab_client_secret
GITLAB_OAUTH_SCOPE="api read_user openid email profile read_repository write_repository"
GitHub OAuth:
GITHUB_CLIENT_ID=your_github_client_id
GITHUB_CLIENT_SECRET=your_github_client_secret
GITHUB_OAUTH_SCOPE="read:user user:email repo"
Required OAuth Scopes:
- GitLab:
read_user openid email profile read_repository write_repositoryapi,read_repositoryandwrite_repositoryare required for Git operations (import projects, sync files, push changes)
- GitHub:
read:user user:email reporeposcope is required for full repository access (read and write operations)
Setting up OAuth Apps:
- GitLab: Create an OAuth application at
https://gitlab.com/-/profile/applications- Set redirect URI to:
http://localhost:5173/apis/auth/callback/gitlab(adjust for production) - Select the required scopes listed above
- Set redirect URI to:
- GitHub: Create an OAuth app at
https://github.com/settings/developers- Set authorization callback URL to:
http://localhost:5173/apis/auth/callback/github(adjust for production) - Request the required scopes listed above
- Set authorization callback URL to:
- GitLab:
-
Initialize Database: The server automatically applies migrations on startup, but you can manually sync the schema:
cd playwright-studio/server npm run db:push -
Start Development: From the root:
npm run dev
📁 Project Structure
├── playwright-studio/
│   ├── client/           # React + Vite Frontend
│   └── server/           # Express + Drizzle Backend
├── itgps-agent/          # CLI Agent for local test execution
├── playwright-studio-extension/ # Chrome Recorder Extension
└── tests/                # Core test suite
🤖 ITG Playwright Studio Agent (itgps-agent)
The itgps-agent is a command-line tool that bridges ITG Playwright Studio data into local Playwright workflows. It enables developers to run tests locally while leveraging Studio-managed configurations, environments, and datasets.
Features
- 🔐 Secure Authentication — Connect to Studio using Personal Access Tokens (PAT)
- 🎯 Project Management — Select and configure projects, environments, and datasets
- 🚀 Remote Test Execution — Trigger Studio-side test runs and stream results in real-time
- 🔄 Git Synchronization — Instruct Studio to pull latest changes from Git repositories
- 🎭 Playwright Integration — Bootstrap Studio data and run any Playwright command locally
- 💾 Offline Support — Cache Studio data for offline test execution
- ⚡ Zero Configuration — Interactive setup wizard guides you through configuration
Installation
Global Installation (Recommended):
npm install -g @itechgenie/itgps-agent
Local Installation:
npm install --save-dev @itechgenie/itgps-agent
Quick Start
-
Configure the Agent:
itgps-agent configThis interactive wizard will:
- Prompt for your Studio URL
- Request your Personal Access Token (PAT)
- Let you select a project, environment, and dataset
- Copy Playwright config to
.itgps/folder - Bootstrap and cache Studio data
-
Install Playwright Browsers:
npx playwright install -
Run Tests Locally:
itgps-agent test
Available Commands
Agent Commands
config— Interactive setup wizard for authentication and project configurationremote-run— Trigger a test run on the Studio server and stream output in real-timestudio-git-sync— Instruct Studio to pull the latest changes from Git
Playwright Commands
All native Playwright commands are supported. The agent bootstraps Studio data before execution:
itgps-agent test                    # Run tests with Studio config
itgps-agent test --headed           # Run in headed mode
itgps-agent test --grep "login"     # Run specific tests
itgps-agent show-report             # View test reports
itgps-agent codegen                 # Generate test code
How It Works
-
Bootstrap Process:
- Reads Studio URL and token from global config or local
.env - Fetches project config, environment variables, and dataset variables from Studio API
- Falls back to cached data if Studio is unreachable
- Merges variables with local
.envoverrides
- Reads Studio URL and token from global config or local
-
Variable Precedence (highest to lowest):
- Local
.envoverrides - Dataset variables
- Environment variables
- Project defaults
- Local
-
Configuration:
- Copies Playwright config to
.itgps/playwright.config.cjs - Users can customize this config as needed
.itgps/folder is automatically added to.gitignore
- Copies Playwright config to
Example Workflow
# Initial setup
cd my-test-project
npm install -D @playwright/test
npm install -g @itechgenie/itgps-agent

# Configure connection to Studio
itgps-agent config
# ✓ Connected to Studio
# ✓ Selected project: "E-Commerce Tests"
# ✓ Selected environment: "Staging"
# ✓ Selected dataset: "Test Users"
# ✓ Playwright config copied to .itgps/playwright.config.cjs
# ✓ Added .itgps/ to .gitignore

# Install browsers
npx playwright install chromium

# Run tests locally with Studio data
itgps-agent test

# Trigger remote run on Studio
itgps-agent remote-run

# Sync Studio with latest Git changes
itgps-agent studio-git-sync
Configuration Files
Global Config (~/.itgps/config.json):
{
  "studioUrl": "https://studio.example.com",
  "token": "your-personal-access-token"
}
Local Environment (.env):
ITGPS_STUDIO_URL=https://studio.example.com
ITGPS_TOKEN=your-personal-access-token
ITGPS_PROJECT_ID=project-uuid
ITGPS_ENV_ID=environment-uuid
ITGPS_DATASET_ID=dataset-uuid
Playwright Config (.itgps/playwright.config.cjs):
- Auto-generated during
itgps-agent config - Fully customizable by users
- Uses environment variables from Studio
- Git-ignored by default
Language Support
The agent works with both JavaScript and TypeScript projects:
JavaScript Example:
// tests/login.spec.js
const { test, expect } = require('@playwright/test');

test('login test', async ({ page }) => {
  const username = process.env.app_username || 'default_user';
  const password = process.env.app_password || 'default_pass';

  await page.goto(process.env.siteurl);
  await page.fill('#username', username);
  await page.fill('#password', password);
  await page.click('#login');

  await expect(page).toHaveURL(/dashboard/);
});
TypeScript Example:
// tests/login.spec.ts
import { test, expect } from '@playwright/test';

test('login test', async ({ page }) => {
  const username = process.env.app_username || 'default_user';
  const password = process.env.app_password || 'default_pass';

  await page.goto(process.env.siteurl!);
  await page.fill('#username', username);
  await page.fill('#password', password);
  await page.click('#login');

  await expect(page).toHaveURL(/dashboard/);
});
Troubleshooting
Authentication Errors:
# Regenerate token in Studio Settings and reconfigure
itgps-agent config
Network Errors:
# Agent automatically uses cached data when offline
# Refresh cache when connection is restored
itgps-agent config
Missing Browsers:
# Install Playwright browsers
npx playwright install
For more details, see the itgps-agent README.
🔗 Git Integration
ITG Playwright Studio supports importing projects directly from GitLab or GitHub repositories, syncing files on demand, and pushing edits back with a commit message — all without needing a local git binary.
Tested Providers
| Provider | Status |
|---|---|
| GitLab | ✅ Tested |
| GitHub | 🧪 Implemented, community testing welcome |
Note: Git integration has been primarily tested with GitLab. If you run into issues with GitHub or any other edge cases, please open a ticket here with steps to reproduce.
Required OAuth Scopes
GitLab — your OAuth app must have these scopes:
api read_api read_user openid email profile read_repository write_repository
GitHub — your OAuth app must have:
read:user user:email repo
Setup
Add these to your playwright-studio/server/.env:
# GitLab
GITLAB_CLIENT_ID=your_client_id
GITLAB_CLIENT_SECRET=your_client_secret

# GitHub
GITHUB_CLIENT_ID=your_client_id
GITHUB_CLIENT_SECRET=your_client_secret
Create your OAuth apps:
- GitLab:
https://gitlab.com/-/profile/applications— set redirect URI tohttp://localhost:5173/apis/auth/callback/gitlab - GitHub:
https://github.com/settings/developers— set callback URL tohttp://localhost:5173/apis/auth/callback/github
If you re-configure scopes on an existing OAuth app, you must log out and log back in to get a new token with the updated scopes.
🐛 Reporting Issues
Found a bug or something not working as expected? Please open an issue and include:
- Steps to reproduce
- Expected vs actual behaviour
- Browser and OS
- Any relevant server/console logs
📜 License
This project is licensed under the MIT License. See LICENSE for details.